


This creates the opportunity for conservative income investors to buy attractively valued high-yield blue-chips like Cisco (NASDAQ:CSCO) at prices not seen in years.
So let me show you the four reasons why now is the time to start buying Cisco, the ultimate high-yield tech utility, for your diversified and prudently risk-managed income portfolio.
Reason One: Cisco Is A Great Tech Utility
Here’s the bottom line upfront on Cisco.
Reasons To Potentially Buy CSCO Today
- 98% quality low-risk 13/13 Ultra SWAN tech utility
- 100% balance safety score
- 3.5% very safe yield
- 0.5% average recession dividend cut risk
- 1.0% severe recession dividend cut risk
- 14% undervalued (potential good buy)
- Fair Value: $50.10 (14.3 PE)
- 12.5X forward earnings vs 13.5 to 14.5 historical
- 8.4X cash-adjusted earnings
- AA- stable outlook credit rating =0.55% 30-year bankruptcy risk
- 85th industry percentile risk management consensus = very good
- 4% to 8% CAGR margin-of-error growth consensus range
- 7.1% CAGR median growth consensus
- 5-year consensus total return potential: 9% to 13% CAGR
- base-case 5-year consensus return potential: 11.5% CAGR (1.5X S&P consensus)
- consensus 12-month total return forecast: 25% (reasonable)
- Fundamentally Justified 12-Month Returns: 19% CAGR
CSCO’s 35% bear market began when it was trading 36% overvalued with a peak PE of 19.5
Its slow but steady tech utility thesis remains firmly intact.
| Metric | 2020 Growth Consensus | 2021 Growth Consensus | 2022 Growth Consensus | 2023 Growth Consensus | 2024 Growth Consensus | 2025 Growth Consensus |
| Sales | -1% | 1% | 4% | 5% | 6% | 9% |
| Dividend | 3% | 3% | 3% | 3% | 3% | NA |
| EPS | 4% | 0% | 4% | 7% | 5% | 11% |
| Operating Cash Flow | 2% | 1% | -7% | 15% | 9% | NA |
| Free Cash Flow | 3% | 1% | -7% | 15% | 10% | NA |
| EBITDA | 1% | -2% | 27% | 1% | 5% | NA |
| EBIT (Operating Income) | 2% | -3% | 29% | 6% | 5% | NA |
(Source: FAST Graphs, FactSet)
Cisco’s Q3 and Outlook Hampered By Supply Chain Challenges” – Morningstar
Cisco’s third-quarter revenue was flat year over year, as sales were impacted by the war in Ukraine, COVID-19 lockdowns in China, and the prior year’s quarter having an extra week. The company stopped operations in Russia and Belarus in March, which had a 2% impact on growth. Cisco’s third-quarter includes April, which had the start of the latest round of lockdowns in China. Not being able to procure and receive components inhibited the final weeks of the quarter and Cisco’s outlook.” – Morningstar
China is expected to start lifting restrictions in Shanghai on June 1st but supply chain bottlenecks could persist for the rest of the year (assuming unlocking goes to plan).
CSCO Rolling Returns Since 2011 (Dividend Era)
(Source: Portfolio Visualizer Premium)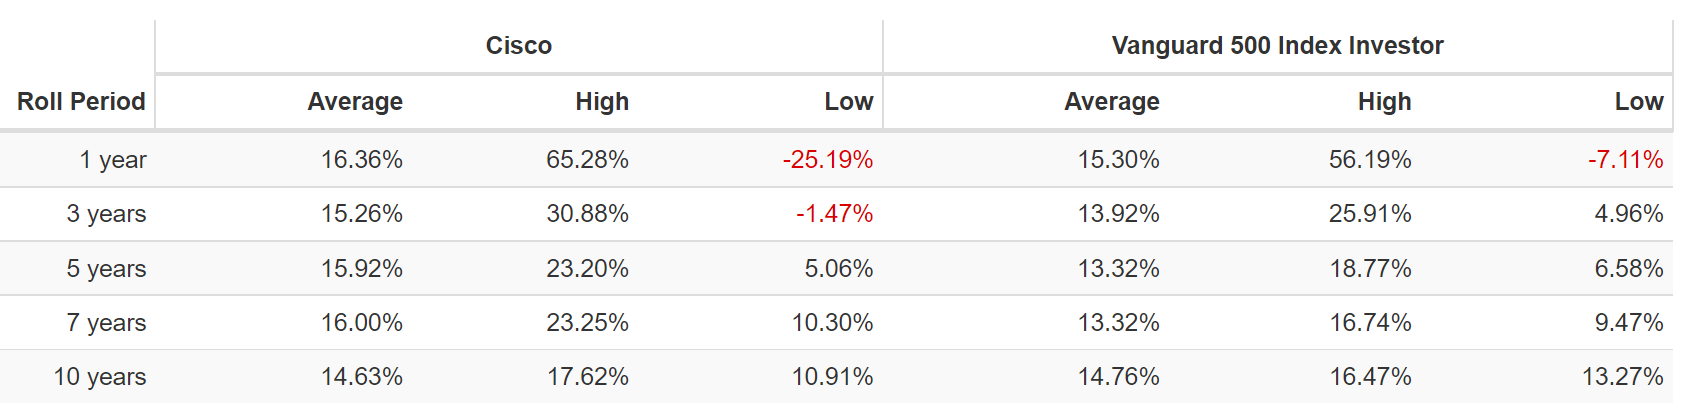
CSCO has delivered very solid returns in the dividend era and is expected to keep slightly exceeding the market in the future.
- from bear market bottoms returns as strong as 18% annually over the next 10 years
- 5X return over a 10 year period
CSCO 2024 Consensus Total Return Potential
(Source: FAST Graphs, FactSet)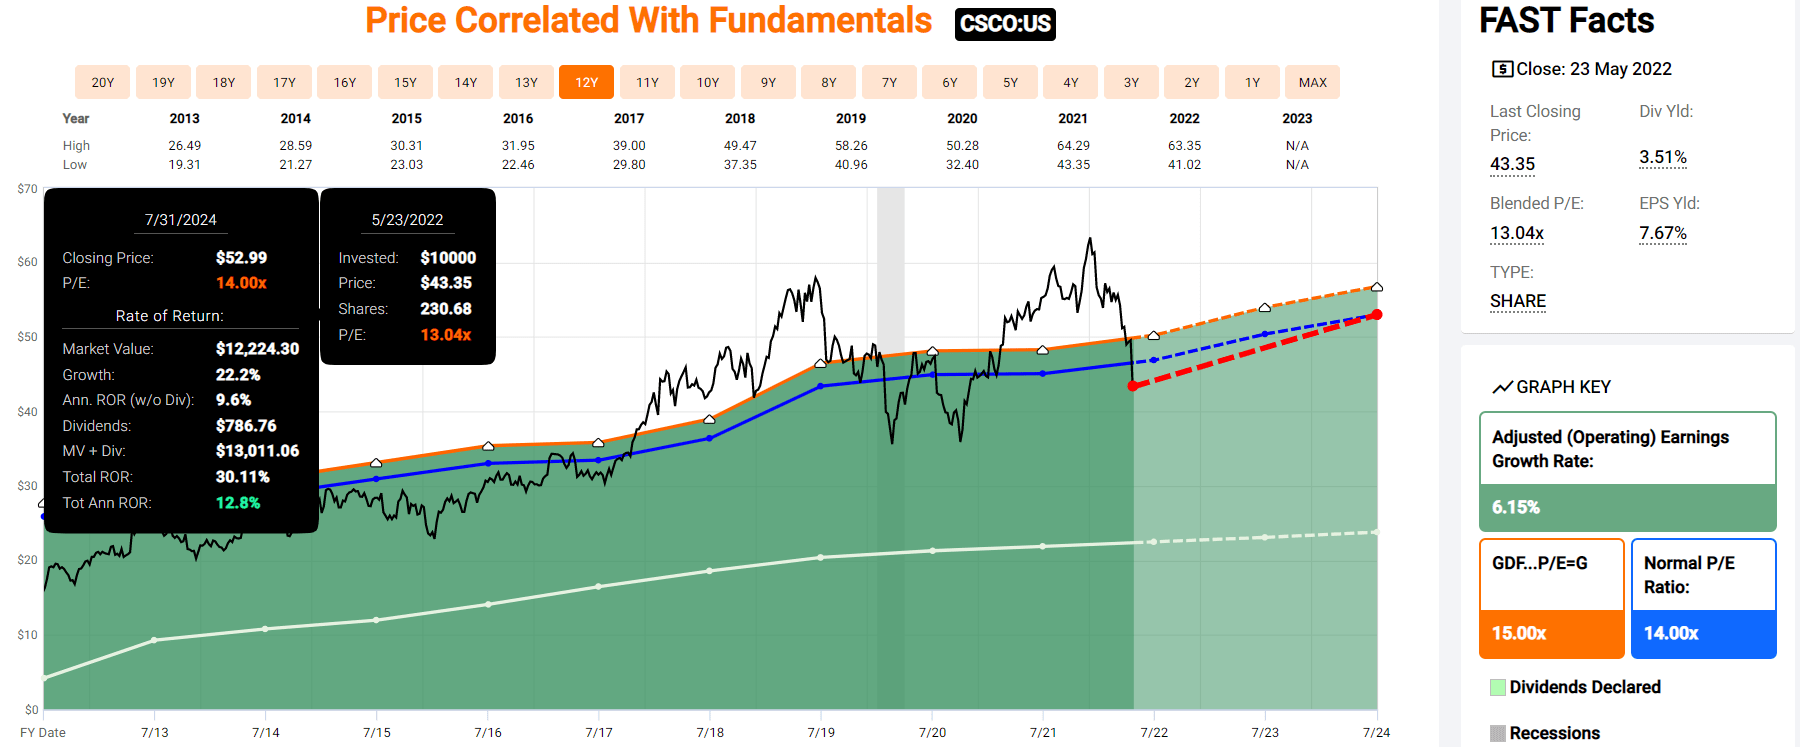
(Source: FAST Graphs, FactSet)
If CSCO grows as analysts expect by 2024 it could deliver 30% total returns or 13% annually.
CSCO 2027 Consensus Total Return Potential
(Source: FAST Graphs, FactSet)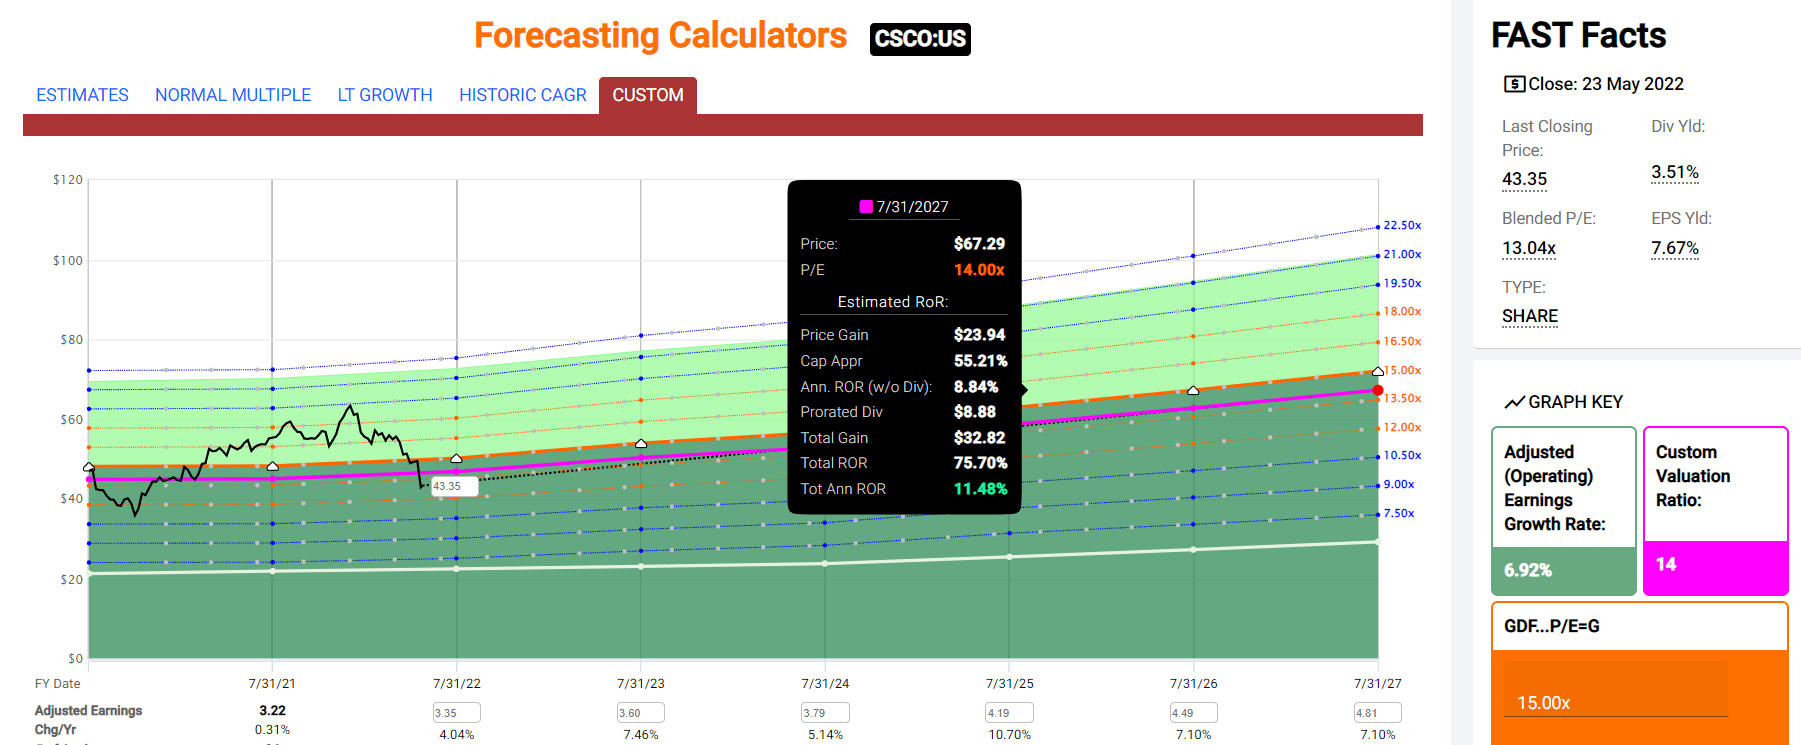
(Source: FAST Graphs, FactSet)
By 2027 if CSCO grows as expected (7% CAGR) and returns to historical fair value, it could deliver 75% total returns or 12% annually.
- 1.5X the S&P 500
CSCO Long-Term Consensus Total Return Potential
| Investment Strategy | Yield | LT Consensus Growth | LT Consensus Total Return Potential | Long-Term Risk-Adjusted Expected Return | Long-Term Inflation And Risk-Adjusted Expected Returns | Years To Double Your Inflation & Risk-Adjusted Wealth | 10 Year Inflation And Risk-Adjusted Expected Return |
| Safe Midstream | 5.6% | 6.0% | 11.6% | 8.1% | 5.6% | 12.9 | 1.72 |
| Adam’s Planned Correction Buys | 4.1% | 19.2% | 23.3% | 16.3% | 13.8% | 5.2 | 3.63 |
| Cisco | 3.5% | 7.10% | 10.6% | 7.4% | 4.9% | 14.8 | 1.61 |
| High-Yield | 3.1% | 12.7% | 15.8% | 11.1% | 8.5% | 8.5 | 2.26 |
| 10-Year US Treasury | 2.9% | 0.0% | 2.9% | 2.9% | 0.4% | 205.7 | 1.04 |
| REITs | 2.8% | 6.5% | 9.3% | 6.5% | 4.0% | 18.2 | 1.47 |
(Sources: Morningstar, FactSet, Ycharts)
- CSCO isn’t expected to beat the dividend aristocrats or Nasdaq, but it does offer an attractive very safe yield and superior return potential to REITs or treasury bonds
- low-risk tech utility
CSCO Total Returns Since 2011 (Dividend Era)
(Source: Portfolio Visualizer Premium) (Source: Portfolio Visualizer Premium)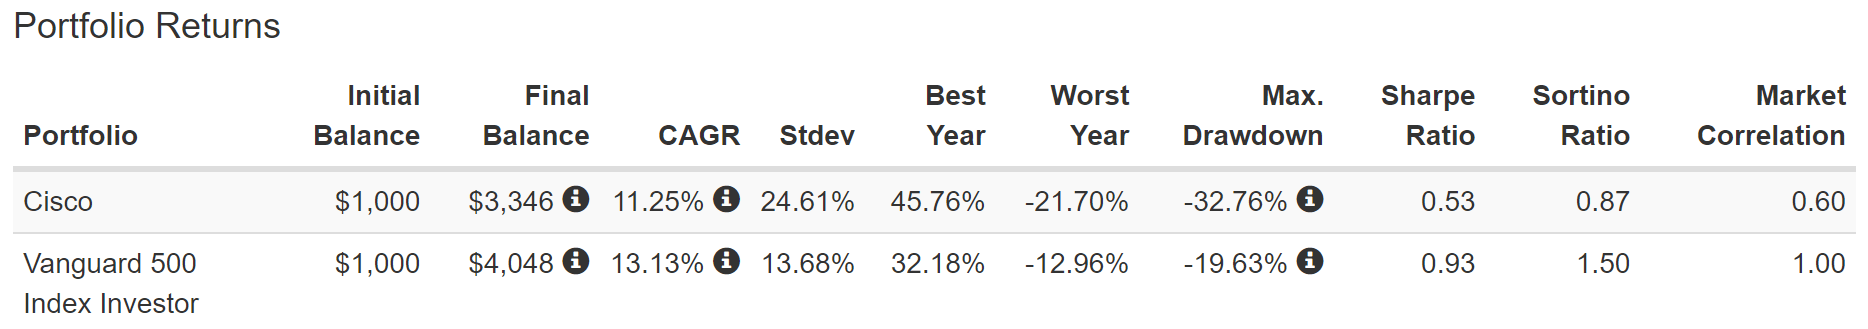
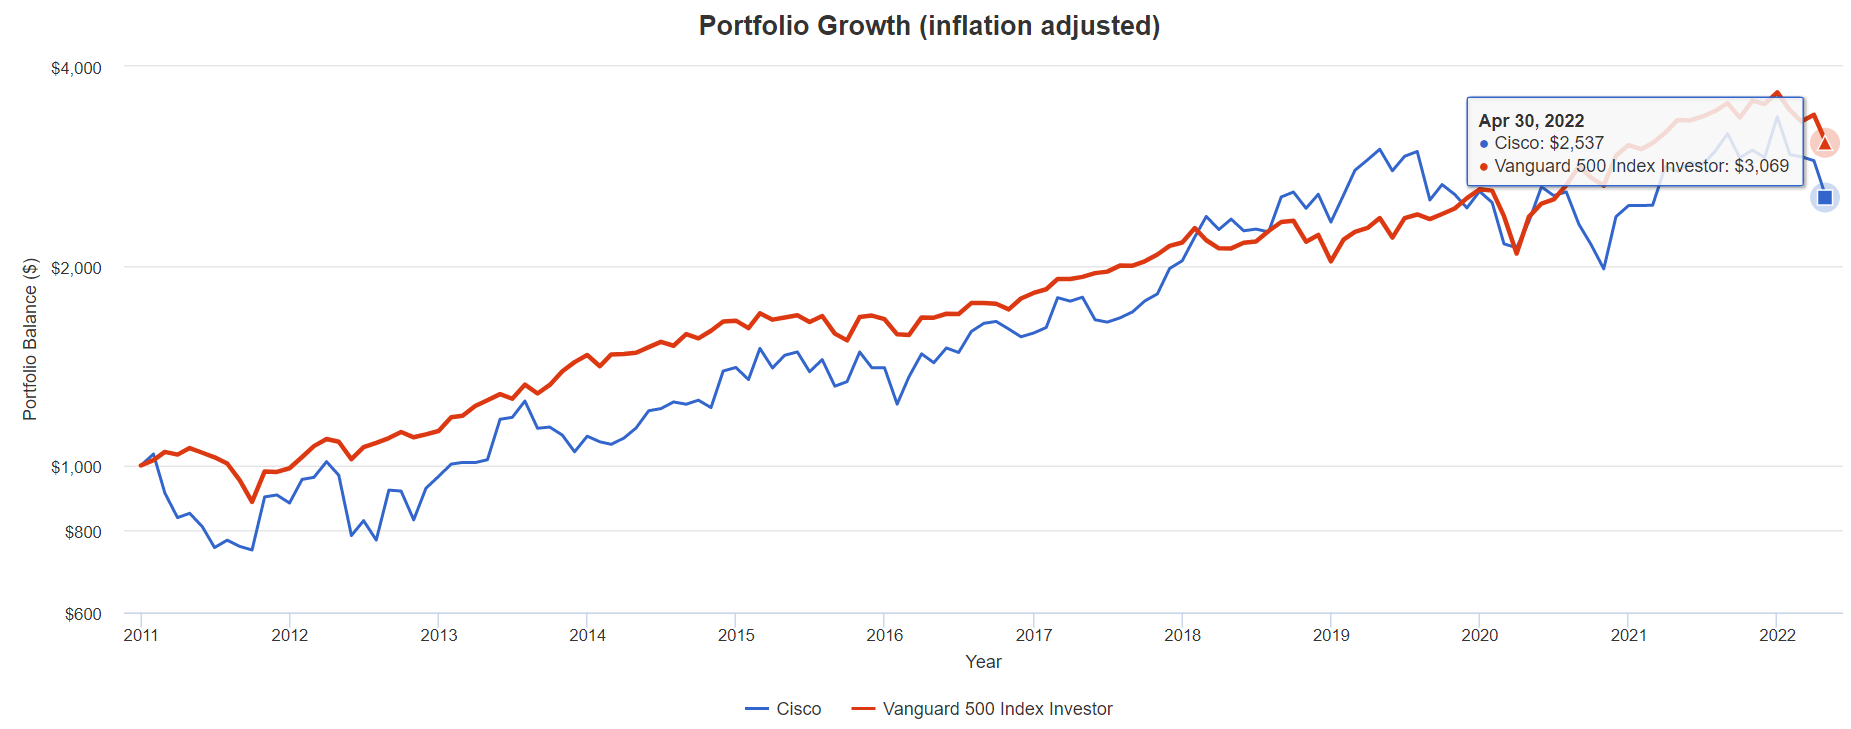
CSCO’s future returns are expected to be similar to its dividend era returns of 11.3%, or 2.5X inflation-adjusted returns over the last 11 years.
What inflation-adjusted returns do analysts expect in the future?
Inflation-Adjusted Consensus Return Potential: $1,000 Initial Investment
| Time Frame (Years) | 7.7% CAGR Inflation-Adjusted S&P Consensus | 8.7% Inflation-Adjusted Aristocrats Consensus | 8.1% CAGR Inflation-Adjusted CSCO Consensus | Difference Between Inflation Adjusted CSCO and S&P Consensus |
| 5 | $1,445.67 | $1,514.08 | $1,507.12 | $61.45 |
| 10 | $2,089.97 | $2,292.44 | $2,271.42 | $181.45 |
| 15 | $3,021.42 | $3,470.93 | $3,423.32 | $401.90 |
| 20 | $4,367.98 | $5,255.26 | $5,159.37 | $791.39 |
| 25 | $6,314.67 | $7,956.89 | $7,775.81 | $1,461.14 |
| 30 | $9,128.95 | $12,047.36 | $11,719.12 | $2,590.16 |
(Source: DK Research Terminal, FactSet)
Over the next 30 years, CSCO could deliver 12X inflation-adjusted returns.
| Time Frame (Years) | Ratio Aristocrats/S&P | Ratio Inflation-Adjusted CSCO Consensus And S&P Consensus |
| 5 | 1.05 | 1.04 |
| 10 | 1.10 | 1.09 |
| 15 | 1.15 | 1.13 |
| 20 | 1.20 | 1.18 |
| 25 | 1.26 | 1.23 |
| 30 | 1.32 | 1.28 |
(Source: DK Research Terminal, FactSet)
CSCO’s role in a portfolio is to offer superior and safer yield, slightly long-term outperformance, and minimal fundamental risk.
CSCO Investment Decision Score
DK
(Source: DK Automated Investment Decision Tool)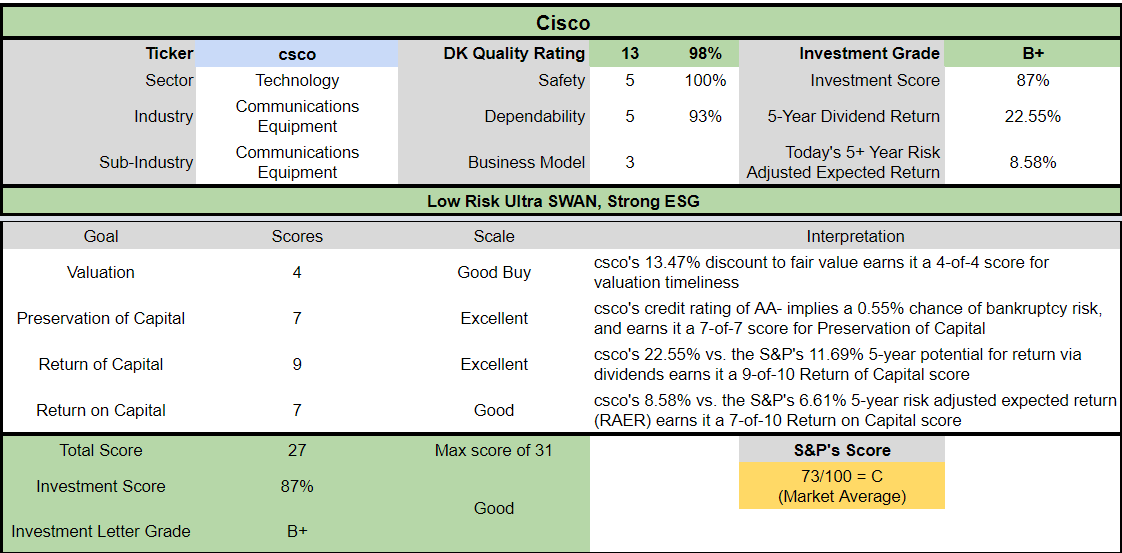
For anyone comfortable with its risk profile, CSCO is a potentially attractive low-risk high-yield tech opportunity.
- 14% discount vs 1% market discount = 13% better valuation
- 4% higher long-term return potential than S&P 500 overtime
- about 33% better risk-adjusted expected return over the next five years
Reason Two: Incredible Quality You Can Trust In All Economic Conditions
There are many ways to measure safety and quality and I factor in pretty much all of them.
The Dividend Kings’ overall quality scores are based on a 253-point model that includes:
- Dividend safety
- Balance sheet strength
- Credit ratings
- Credit default swap medium-term bankruptcy risk data
- Short and long-term bankruptcy risk
- Accounting and corporate fraud risk
- Profitability and business model
- Growth consensus estimates
- Management growth guidance
- Historical earnings growth rates
- Historical cash flow growth rates
- Historical dividend growth rates
- Historical sales growth rates
- Cost of capital
- GF Scores
- Long-term risk-management scores from MSCI, Morningstar, FactSet, S&P, Reuters’/Refinitiv, and Just Capital
- Management quality
- Dividend friendly corporate culture/income dependability
- Long-term total returns (a Ben Graham sign of quality)
- Analyst consensus long-term return potential
In fact, it includes over 1,000 fundamental metrics including the 12 rating agencies we use to assess fundamental risk.
- credit and risk management ratings make up 41% of the DK safety and quality model
- dividend/balance sheet/risk ratings make up 82% of the DK safety and quality model
How do we know that our safety and quality model works well?
During the two worst recessions in 75 years, our safety model 87% of blue-chip dividend cuts, the ultimate baptism by fire for any dividend safety model.
How does CSCO score on our comprehensive safety and quality models?
CSCO Dividend Safety
| Rating | Dividend Kings Safety Score (162 Point Safety Model) | Approximate Dividend Cut Risk (Average Recession) | Approximate Dividend Cut Risk In Pandemic Level Recession |
| 1 – unsafe | 0% to 20% | over 4% | 16+% |
| 2- below average | 21% to 40% | over 2% | 8% to 16% |
| 3 – average | 41% to 60% | 2% | 4% to 8% |
| 4 – safe | 61% to 80% | 1% | 2% to 4% |
| 5- very safe | 81% to 100% | 0.5% | 1% to 2% |
| CSCO | 100% | 0.5% | 1.0% |
| Risk Rating | Low-Risk (85th industry percentile risk-management consensus) | AA- Stable outlook credit rating 0.55% 30-year bankruptcy risk | 20% OR LESS Max Risk Cap Recommendation |
Long-Term Dependability
| Company | DK Long-Term Dependability Score | Interpretation | Points |
| Non-Dependable Companies | 21% or below | Poor Dependability | 1 |
| Low Dependability Companies | 22% to 60% | Below-Average Dependability | 2 |
| S&P 500/Industry Average | 61% (61% to 70% range) | Average Dependability | 3 |
| Above-Average | 71% to 80% | Very Dependable | 4 |
| Very Good | 81% or higher | Exceptional Dependability | 5 |
| CSCO | 93% | Exceptional Dependability | 5 |
Overall Quality
| CSCO | Final Score | Rating |
| Safety | 100% | 5/5 Very Safe |
| Business Model | 100% | 3/3 Wide And Stable Moat |
| Dependability | 93% | 5/5 Exceptional |
| Total | 98% | 13/13 Ultra SWAN |
| Risk Rating | 3/3 Low Risk | |
| 15% OR LESS Max Risk Cap Rec | 10% Margin of Safety For A Potentially Good Buy |
What does a 98% quality score mean?
Cisco is the 12th highest quality company on the Master List (98th percentile)
How impressive is this fact?
The DK 500 Master List includes the world’s highest quality companies including:
- All dividend champions
- All dividend aristocrats
- All dividend kings
- All global aristocrats (such as BTI, ENB, and NVS)
- All 13/13 Ultra Swans (as close to perfect quality as exists on Wall Street)
- 49 of the world’s best growth stocks
In other words, even among the world’s best companies, CSCO is higher quality than 98% of them.
Why I Trust Cisco And So Can You
Cisco was founded in San Jose, California in 1984.
Its specialty is the hardware backbone of the internet and networks.
- its routers and switching solutions are the backbones of the internet
- it’s also expanding into network security
- with a goal of transitioning to a hybrid hardware/subscription business model
Recurring revenue is more stable and leads to higher multiples for companies.
- it’s why REITs growing 6% over time are valued at 17X cash flow
- and utilities growing at 5% are worth about 18X to 20X
- and even KO growing at a modest rate is worth 20X to 21X (CLX also)
We note that Cisco’s networking products are typically upgraded every three-to-seven years, and consumers typically keep the existing vendor in place as to not disturb the network. Changing network systems is a massive undertaking due to migrating existing data and infrastructure hardware to a new architecture; any network disturbance can have a tremendous cost. The more critical the application, the higher the reluctance to make a change. Most firms are inherently risk-averse to making enterprise network changes like swapping vendors, especially if the existing network has kept business operations functional. Furthermore, competitors publicly acknowledge the difficulty in taking market share from Cisco’s dominance as the incumbent solution. Pricing power is indicated by steady low- to mid-60% gross margins over the last decade even as competitors entered the market.” – Morningstar
CSCO is a very boring but beautiful business, offering good solutions to enterprise clients who are highly conservative and risk-averse.
Cisco’s shift into selling subscription-based hardware, software, and services as three-, five-, or seven-year packages have further entwined the company within its expansive customer base. New products are sold with this scheme, and Cisco is working on adopting the model to incumbent products. Data analytics and intent-based networking make Cisco stickier with the customer, since losing such valuable software capabilities can be detrimental to business results and network operations. Beyond network operation products, changing to a different security vendor can seem like a risky proposition if threats have been mitigated in the past.” – Morningstar
Cisco’s plans to become a one-stop solution provider to its clients are going well so far, with most customers trusting it after decades of solid results.
- creating a relatively sticky ecosystem and wide moat
We believe that our revenue performance in the upcoming quarters is less dependent on demand and more dependent on supply availability in this increasingly complex environment. While certain aspects of the current situation are largely out of our control, our teams have been working on several mitigation actions to help alleviate many of the component issues that we’ve been facing. We believe that we will begin to see the benefits of these actions in the first half of the next fiscal year.” – CEO, fiscal Q3 conference call
Cisco is supply-constrained at the moment, with a record backlog of demand it simply can’t fill thanks to China’s lock-downs.
Recurring revenue is growing at 11%, while sales were flat.
The backlog is up 130% to a record $15 billion.
New orders grew at 8%, indicating healthy overall demand.
Subscription revenue now makes up about 44% of sales and is the fastest-growing part of the business.
New order growth ranged from 4% to 11% in all geographic regions.
CSCO’s buyback authorization stands at $17.6 billion after buying back $252 million worth of shares at an average price of $54.2 in Q3 (our Q1).
- enough to buy back about 10% of shares at current valuations
Bottom Line: Cisco’s Investment Thesis Remains Intact, Steadily Growing Recurring Revenue From This Tech Utility
Now let’s take a look at the math backing up CSCO’s investment thesis.
Quantitative Analysis: The Math Backing Up The Investment Thesis
CSCO Credit Ratings
| Rating Agency | Credit Rating | 30-Year Default/Bankruptcy Risk | Chance of Losing 100% Of Your Investment 1 In |
| S&P | AA- stable | 0.55% | 181.8 |
| Moody’s | A1 (A+ equivalent) Stable Outlook | 0.60% | 166.7 |
| Consensus | A+ Stable Outlook | 0.58% | 173.9 |
(Source: S&P, Moody’s)
Rating agencies estimate a 0.58% fundamental risk in buying Cisco today.
- 1 in 174 chance of losing all your money over the next 30 years
CSCO Leverage Consensus Forecast
| Year | Debt/EBITDA | Net Debt/EBITDA (3.0 Or Less Safe According To Credit Rating Agencies) | Interest Coverage (8+ Safe) |
| 2020 | 0.79 | -0.80 | 28.46 |
| 2021 | 0.62 | -0.70 | 38.48 |
| 2022 | 0.48 | -0.56 | 48.93 |
| 2023 | 0.47 | -0.83 | 51.47 |
| 2024 | 0.42 | -1.08 | 53.33 |
| Annualized Change | -14.83% | 7.67% | 17.00% |
(Source: FactSet Research Terminal)
CSCO has more cash than debt already and its balance sheet is expected to get slowly but steadily stronger over time.
CSCO Balance Sheet Consensus Forecast
| Year | Total Debt (Millions) | Cash | Net Debt (Millions) | Interest Cost (Millions) | EBITDA (Millions) | Operating Income (Millions) |
| 2020 | $14,583 | $11,809 | -$14,836 | $585 | $18,458 | $16,650 |
| 2021 | $11,526 | $9,175 | -$12,992 | $434 | $18,564 | $16,702 |
| 2022 | $9,418 | $13,550 | -$10,892 | $354 | $19,558 | $17,320 |
| 2023 | $9,085 | $20,746 | -$16,264 | $350 | $19,483 | $18,014 |
| 2024 | $8,501 | $22,254 | -$22,088 | $360 | $20,445 | $19,200 |
| 2025 | $8,221 | $20,639 | NA | NA | NA | $21,346 |
| Annualized Growth | -10.83% | 11.81% | 10.46% | -11.43% | 2.59% | 5.09% |
(Source: FactSet Research Terminal)
Debt is falling at double digits, while cash is growing at double digits and cash flows are growing at a modest pace.
Bond Profile
- $24 billion in liquidity
- 100% unsecured bonds (maximum financial flexibility)
- well-staggered bond maturities, no trouble refinancing maturing debt
- 3.45% average borrowing cost vs bond market’s 2.55% long-term inflation forecast
- CSCO’s effective real interest rate is 0.9% vs 26.3% return on invested capital
CSCO Credit Default SWAP Spreads: Bond Market’s Real-Time Fundamental Risk Assessment
(Source: FactSet Research Terminal)
Credit default swaps are insurance against bond defaults, and thus represent a real-time bond market estimate of a company’s short and medium-term bankruptcy risk.
CSCO’s CDS indicating fundamental risk has soared in recent months.
Mainly after China’s lockdowns began.
1-year bankruptcy risk has doubled to 0.13%.
- 10-year risk is up 36% in the last 6 months to a still-low 0.58%
- the bond market is pricing in 1.74% 30-year bankruptcy risk which is consistent with an A- positive outlook credit rating
The bond market is basically agreeing with rating agencies and analysts that CSCO’s investment thesis remains intact.
CSCO GF Score: The Newest Addition To The DK Safety And Quality Model
The GF Score is a ranking system that has been found to be closely correlated to the long-term performances of stocks by backtesting from 2006 to 2021.” – Gurufocus
GF Score takes five key aspects into consideration. They are:
- Financial Strength
- Profitability
- Growth
- Valuation
- Momentum
(Source: Gurufocus Premium)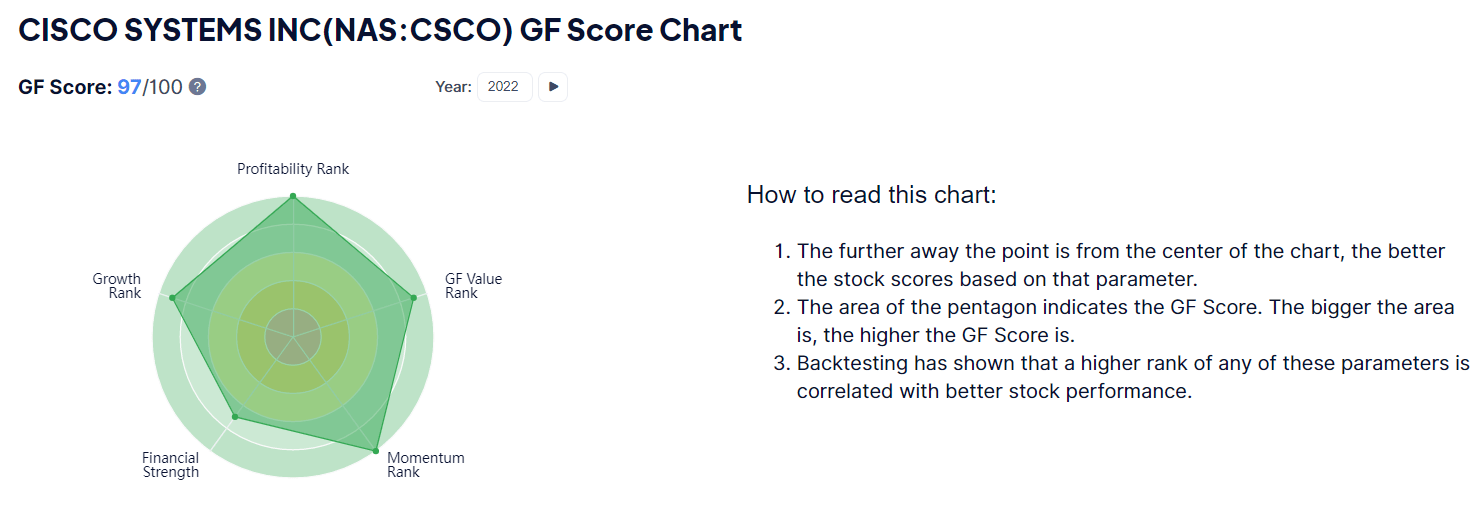
CSCO’s exceptionally strong 97/100 GF score confirms its excellent fundamentals as well as attractive valuation.
An industry leader in financial strength, profitability, growth, and valuation.
Profitability: Wall Street’s Favorite Quality Proxy
(Source: Gurufocus Premium)
CSCO’s profitability is historically within the top 10% of its peers.
CSCO Trailing 12-Month Profitability Vs Peers
| Metric | Industry Percentile | Major Tech Hardware Makers More Profitable Than CSCO (Out Of 2,390) |
| Gross Margins | 94.76 | 125 |
| Operating Margin | 96.54 | 83 |
| Net Margin | 94.90 | 122 |
| Return On Equity | 94.22 | 138 |
| Return On Assets | 90.21 | 234 |
| Returns On Invested Capital | 76.74 | 556 |
| Return On Capital | 99.50 | 12 |
| Return On Capital Employed | 86.89 | 313 |
| Average | 91.29 | 208 |
(Source: Gurufocus Premium)
Profitability in the last year has been in the top 9% of its peers.
CSCO’s profitability is relatively stable over the last 30 years, confirming its wide and stable moat.
- FCF margins of 30% are in the top 10% of all companies on earth
CSCO Margin Consensus Forecast
| Year | FCF Margin | EBITDA Margin | EBIT (Operating) Margin | Net Margin | Return On Capital Expansion | Return On Capital Forecast |
| 2020 | 29.7% | 37.4% | 33.8% | 27.7% | 1.04 | |
| 2021 | 29.6% | 37.3% | 33.5% | 27.4% | TTM ROC | 681.15% |
| 2022 | 25.6% | 38.1% | 33.8% | 27.4% | Latest ROC | 743.62% |
| 2023 | 29.1% | 36.6% | 33.9% | 27.7% | 2025 ROC | 709.88% |
| 2024 | 30.5% | 36.6% | 34.4% | 28.1% | 2025 ROC | 774.99% |
| 2025 | 34.3% | NA | 34.9% | 29.3% | Average | 742.43% |
| 2026 | NA | NA | NA | NA | Industry Median | 13.53% |
| 2027 | NA | NA | NA | NA | CSCO/Industry Median | 54.87 |
| Annualized Growth | 2.92% | -0.58% | 0.68% | 1.14% | Vs S&P | 50.85 |
| Annualized Growth (Ignoring Pandemic) | 3.75% | -0.62% | 1.04% | 1.74% |
(Source: FactSet Research Terminal)
CSCO’s margins are expected to remain stable or improve slowly over time, up to 34% FCF margins in 2025.
Return on capital is pre-tax profit/operating capital (the money it takes to run the business).
- Joel Greenblatt’s gold standard proxy for quality and moatiness
Analysts are expecting ROC to increase modestly by 2025 to 742%.
- and achieve almost 55X the industry norm
- and more than 51X the S&P 500
CSCO’s ROC Has Been Rising For Over 25 Years
CSCO’s ROC has been rising as its transitions to a software-focused recurring revenue business model.
700% to 800% ROC that’s trending higher for decades is a confirmation of a wide and stable moat.
- and one of the highest quality companies on earth
Reason Three: Decent Growth Outlook For Decades To Come
Cisco’s growth is tied to the growth of the internet, specifically cloud computing.
- a potential $10 trillion annual industry by 2035
CSCO Growth Spending Consensus Forecast
| Year | SG&A (Selling, General, Administrative) | R&D | Capex | Total Growth Spending | Sales | Growth Spending/Sales |
| 2020 | $9,483 | $5,572 | $770 | $15,825 | $49,301 | 32.10% |
| 2021 | $10,588 | $5,624 | $692 | $16,904 | $49,818 | 33.93% |
| 2022 | $10,256 | $5,749 | $510 | $16,515 | $51,309 | 32.19% |
| 2023 | $10,515 | $5,845 | $625 | $16,985 | $53,163 | 31.95% |
| 2024 | $11,207 | $6,077 | $696 | $17,980 | $55,895 | 32.17% |
| 2025 | $12,576 | $6,582 | $528 | $19,686 | $61,093 | 32.22% |
| Annualized Growth | 5.81% | 3.39% | -7.27% | 4.46% | 4.38% | 0.08% |
| Total Spending 2022 To 2025 | $44,554 | $24,253 | $2,359 | $71,166 | $221,460 | NA |
(Source: FactSet Research Terminal)
CSCO is a capex light business and mature company.
Growth spending is now growing in line with sales, representing about 32% of revenue.
Total growth spending over the next four years is expected to be about $72 billion including $24 billion on R&D.
CSCO Medium-Term Growth Consensus Forecast
| Year | Sales | Free Cash Flow | EBITDA | EBIT (Operating Income) | Net Income |
| 2020 | $49,301 | $14,656 | $18,458 | $16,650 | $13,658 |
| 2021 | $49,818 | $14,762 | $18,564 | $16,702 | $13,636 |
| 2022 | $51,309 | $13,114 | $19,558 | $17,320 | $14,075 |
| 2023 | $53,163 | $15,493 | $19,483 | $18,014 | $14,711 |
| 2024 | $55,895 | $17,060 | $20,445 | $19,200 | $15,717 |
| 2025 | $61,093 | $20,972 | NA | $21,346 | $17,915 |
| Annualized Growth | 4.38% | 7.43% | 2.59% | 5.09% | 5.58% |
| Annualized Growth (Ignoring Pandemic) | 5.23% | 9.18% | 3.27% | 6.33% | 7.06% |
| Cumulative Over The Next 6 Years | $221,460 | $66,639 | $59,486 | $75,880 | $62,418 |
(Source: FactSet Research Terminal)
CSCO is a modestly growing business, generating 5% sales growth outside of the pandemic.
The bottom line is growing slightly faster at 7% for net income and 9% for free cash flow.
CSCO Dividend Growth/Buy Back Potential Consensus Forecast
| Year | Dividend Consensus | FCF/Share Consensus | FCF Payout Ratio | Retained (Post-Dividend) Free Cash Flow | Buyback Potential | Debt Repayment Potential |
| 2021 | $1.46 | $3.50 | 41.7% | $8,474 | 4.71% | 73.5% |
| 2022 | $1.50 | $3.03 | 49.5% | $6,356 | 3.53% | 67.5% |
| 2023 | $1.54 | $3.72 | 41.4% | $9,056 | 5.03% | 96.2% |
| 2024 | $1.59 | $3.80 | 41.8% | $9,180 | 5.10% | 101.0% |
| Total 2022 Through 2024 | $4.63 | $10.55 | 43.9% | $33,065.84 | 18.36% | 351.09% |
| Annualized Rate | 2.88% | 2.78% | 0.10% | 2.70% | 2.70% | 11.18% |
(Source: FactSet Research Terminal)
CSCO’s dividend growth isn’t expected to be that impressive, merely a 3% annual growth that the bond market expects to keep up with inflation.
But at a 44% average consensus FCF payout ratio it’s a very safe dividend.
- rating agencies consider 60% FCF payout ratios safe for this industry
CSCO is expected to retain $33 billion in post-dividend free cash flow in the next three years, enough to pay off its debt by 3.5X or buy back up to 18% of its shares at current valuations.
CSCO Buy Back Consensus Forecast
| Year | Consensus Buybacks ($ Millions) | % Of Shares (At Current Valuations) | Market Cap |
| 2022 | $6,284.0 | 3.5% | $180,083 |
| 2023 | $2,750.0 | 1.5% | $180,083 |
| 2024 | $4,000.0 | 2.2% | $180,083 |
| 2025 | $3,000.0 | 1.7% | $180,083 |
| Total 2022-2023 | $16,034.00 | 8.9% | $180,083 |
| Annualized Rate | 2.30% | Average Annual Buybacks | $4,008.50 |
(Source: FactSet Research Terminal)
Analysts expect CSCO to front-load its $16 billion in buybacks through 2025 in 2022.
- prudent in a bear market
At current valuations, analysts think CSCO could buy back 2.3% of shares each year.
Since CSCO began steady buybacks in 2002, it’s averaged a net repurchase rate of 2.8% per year.
- 44% of stock repurchases over the last two decades
| Time Frame (Years) | Net Buyback Rate | Shares Remaining | Net Shares Repurchased | Each Share You Own Is Worth X Times More (Not Including Future Growth And Dividends) |
| 5 | 2.3% | 89.02% | 10.98% | 1.12 |
| 10 | 2.3% | 79.24% | 20.76% | 1.26 |
| 15 | 2.3% | 70.54% | 29.46% | 1.42 |
| 20 | 2.3% | 62.79% | 37.21% | 1.59 |
| 25 | 2.3% | 55.89% | 44.11% | 1.79 |
| 30 | 2.3% | 49.76% | 50.24% | 2.01 |
(Source: FactSet Research Terminal)
At the consensus buyback rate, CSCO could buy back 50% of its stock within the next 30 years.
- doubling the value of your shares’ intrinsic value
- ignoring future dividend and earnings growth
- and inflation
CSCO Long-Term Growth Outlook
(Source: FactSet Research Terminal)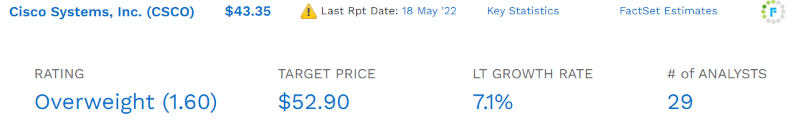
- 20-year growth rate: 10.9% CAGR
- consensus growth range (5 sources): 5.4% to 7.1% CAGR
- median growth consensus from all analysts: 7.1% CAGR
How accurate are analysts at forecasting CSCO’s growth over time?
FAST Graphs, FactSet FAST Graphs, FactSet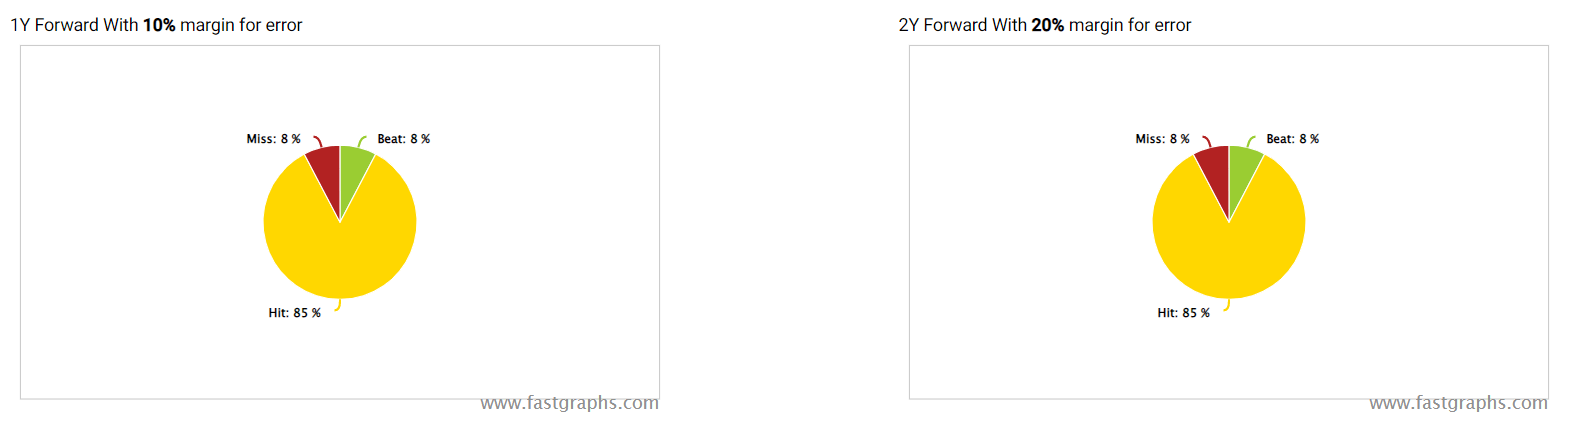
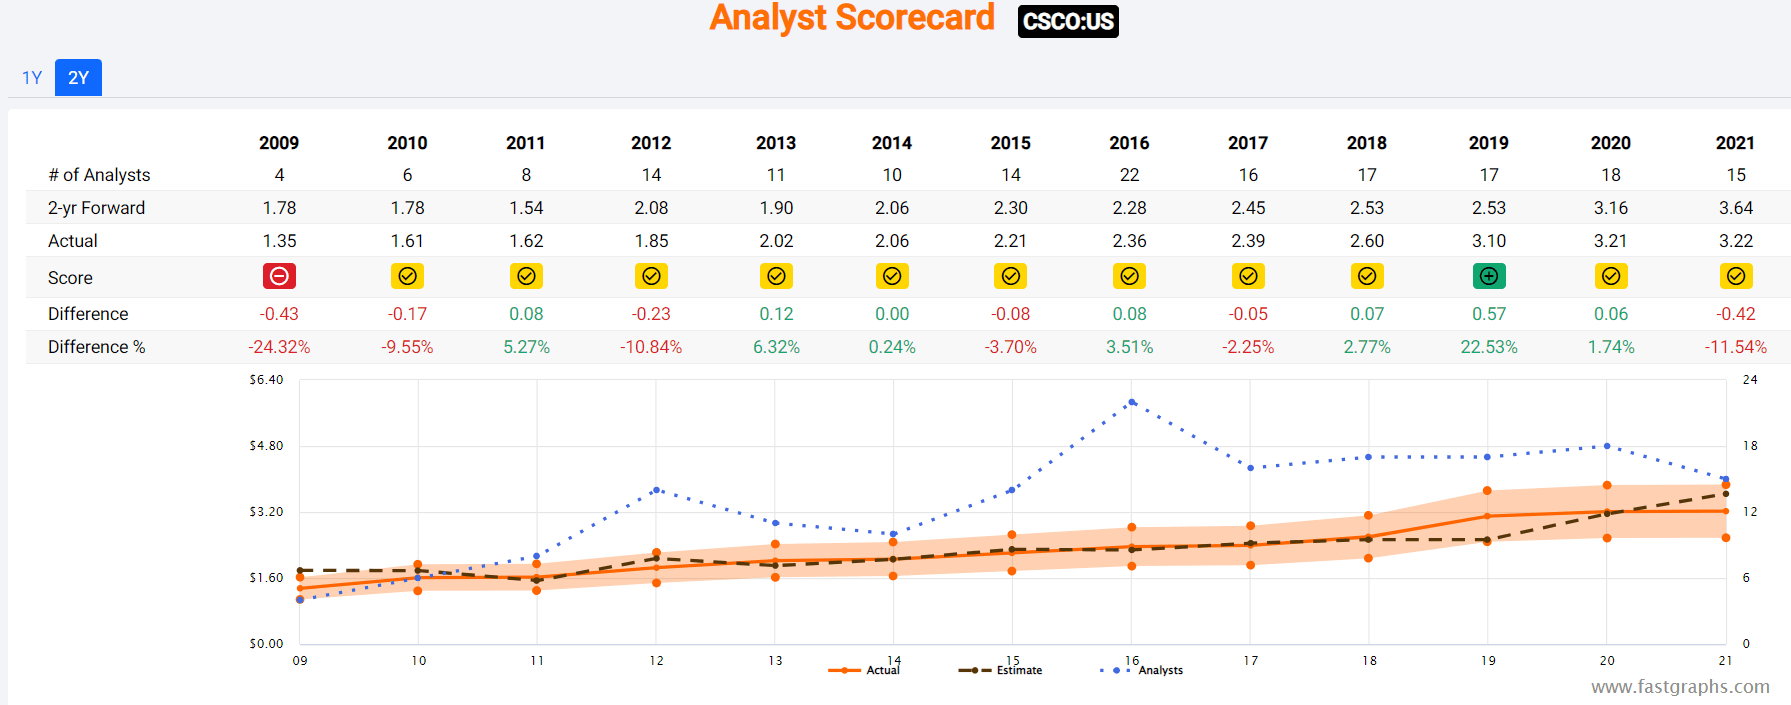
Smoothing for outliers analyst margins of error are 5% to the downside and 5% to the upside.
- 4% to 8% CAGR historical margin of error adjusted growth consensus range
- 70% statistical probability CSCO grows at 4% to 8% over time
CSCO’s historical growth rates over the last 20 years ranged from 0% to 11% and analysts expect future growth to be similar to the last 14 years.
Reason Four: A Wonderful Company At An Attractive Price
Ignoring the tech bubble, CSCO’s market-determined fair value is 13.5X to 14.5X, slightly towards the highest end of that range.
| Metric | Historical Fair Value Multiples (12-years) | 2021 | 2022 | 2023 | 2024 | 12-Month Forward Fair Value |
| 5-Year Average Yield | 2.97% | $49.83 | $51.18 | $51.18 | $52.53 | |
| Earnings | 14.00 | $45.92 | $48.16 | $50.96 | $55.44 | |
| Average | $47.80 | $49.62 | $51.07 | $53.94 | $50.18 | |
| Current Price | $43.35 | |||||
| Discount To Fair Value | 9.30% | 12.64% | 15.11% | 19.64% | 13.61% | |
| Upside To Fair Value (NOT Including Dividends) | 10.26% | 14.47% | 17.81% | 24.44% | 15.75% (19% including dividend) | |
| 2022 EPS | 2023 EPS | 2022 Weighted EPS | 2023 Weighted EPS | 12-Month Forward EPS | 12-Month Average Fair Value Forward PE | Current Forward PE |
| $3.44 | $3.64 | $2.12 | $1.40 | $3.52 | 14.3 | 12.3 |
I estimate CSCO is worth about 14.3X earnings and today it trades at 12.3X.
- 8.8X cash-adjusted earnings
| Analyst Median 12-Month Price Target | Morningstar Fair Value Estimate |
| $52.90 (15.0 PE) | $54.00 (15.4) |
| Discount To Price Target (Not A Fair Value Estimate) | Discount To Fair Value |
| 18.05% | 19.72% |
| Upside To Price Target (Not Including Dividend) | Upside To Fair Value (Not Including Dividend) |
| 22.03% | 24.57% |
| 12-Month Median Total Return Price (Including Dividend) | Fair Value + 12-Month Dividend |
| $54.42 | $55.52 |
| Discount To Total Price Target (Not A Fair Value Estimate) | Discount To Fair Value + 12-Month Dividend |
| 20.34% | 21.92% |
| Upside To Price Target ( Including Dividend) | Upside To Fair Value + Dividend |
| 24.72% | 28.07% |
Morningstar’s DCF model estimates CSCO to be worth 15.4X earnings (not unreasonable but slightly high by historical standards).
Analysts expect it to trade at 15X in 12 months, generating 25% total returns.
I don’t care about 12-month price forecasts, just whether or not the current market of safety sufficiently compensates you for the risk profile.
| Rating | Margin Of Safety For Low-Risk 13/13 Ultra SWAN quality companies | 2022 Price | 2023 Price | 12-Month Forward Fair Value |
| Potentially Reasonable Buy | 0% | $49.62 | $51.07 | $50.18 |
| Potentially Good Buy | 5% | $47.14 | $48.52 | $47.67 |
| Potentially Strong Buy | 15% | $42.18 | $43.41 | $42.65 |
| Potentially Very Strong Buy | 25% | $35.36 | $38.30 | $37.63 |
| Potentially Ultra-Value Buy | 35% | $32.26 | $33.19 | $32.62 |
| Currently | $43.35 | 12.64% | 15.11% | 13.61% |
| Upside To Fair Value (Not Including Dividends) | 14.47% | 17.81% | 15.75% |
For anyone comfortable with its risk profile CSCO is a potentially good buy and about 2% away from becoming a potentially strong buy.
Risk Profile: Why Cisco Isn’t Right For Everyone
There are no risk-free companies and no company is right for everyone. You have to be comfortable with the fundamental risk profile.
What Could Cause CSCO’s Investment Thesis To Break
- safety falls to 40% or less
- balance sheet collapses (highly unlikely, 0.55% probability according to S&P)
- loses significant market share to rivals such as Paulo Alto Networks
- failure of recurring revenue business model transition plan
- growth outlook falls to less than 5.5% for seven years
- CSCO’s role in my portfolio is to deliver long-term 8+% returns with minimal fundamental risk (I treat it as a defensive tech utility)
How long it takes for a company’s investment thesis to break depends on the quality of the company.
| Quality | Years For The Thesis To Break Entirely |
| Below-Average | 1 |
| Average | 2 |
| Above-Average | 3 |
| Blue-Chip | 4 |
| SWAN | 5 |
| Super SWAN | 6 |
| Ultra SWAN | 7 |
| 100% Quality Companies (MSFT, LOW, and MA) | 8 |
These are my personal rule of thumb for when to sell a stock if the investment thesis has broken.
CSCO is highly unlikely to suffer such catastrophic declines in fundamentals.
CSCO’s Risk Profile Includes
- inherent cyclicality of the tech hardware industry (falling with recurring revenue transition)
- disruption risk (commodity white box solutions are a threat to its high margin business)
- M&A execution risk (CSCO does a lot of small bolt-on acquisitions)
- labor retention risk (tightest job market in over 50 years and finance is a high paying industry)
- cybersecurity risk: hackers and ransomware
- currency risk: 48% of sales are from outside the US
How do we quantify, monitor, and track such a complex risk profile? By doing what big institutions do.
Long-Term Risk Analysis: How Large Institutions Measure Total Risk
- see the risk section of this video to get an in-depth view (and link to two reports) of how DK and big institutions measure long-term risk management by companies
CSCO Long-Term Risk Management Consensus
| Rating Agency | Industry Percentile | Rating Agency Classification |
| MSCI 37 Metric Model | 98.0% | AA, Industry Leader, Positive Trend |
| Morningstar/Sustainalytics 20 Metric Model | 87.1% | 12.1/100 Low-Risk |
| Reuters’/Refinitiv 500+ Metric Model | 98.4% | Excellent |
| S&P 1,000+ Metric Model | 78.0% | Good, Stable Trend |
| Just Capital 19 Metric Model | 90.5% | Excellent |
| FactSet | 30.0% | Below-Average, Positive Trend |
| Morningstar Global Percentile (All 15,000 Rated Companies) | 96.5% | Exceptional |
| Just Capital Global Percentile (All 954 Rated US Companies) | 99.0% | Exceptional, 10th best in the country |
| Consensus | 85% | Low-Risk, Very Good Risk-Management, Stable Trend |
(Sources: MSCI, Morningstar, FactSet, JustCapital, Reuters, S&P)
CSCO’s Long-Term Risk Management Is The 30th Best In The Master List (94th Percentile)
| Classification | Average Consensus LT Risk-Management Industry Percentile | Risk-Management Rating |
| S&P Global (SPGI) #1 Risk Management In The Master List | 94 | Exceptional |
| Cisco | 85 | Very Good |
| Strong ESG Stocks | 78 | Good – Bordering On Very Good |
| Foreign Dividend Stocks | 75 | Good |
| Ultra SWANs | 71 | Good |
| Low Volatility Stocks | 68 | Above-Average |
| Dividend Aristocrats | 67 | Above-Average |
| Dividend Kings | 63 | Above-Average |
| Master List average | 62 | Above-Average |
| Hyper-Growth stocks | 61 | Above-Average |
| Monthly Dividend Stocks | 60 | Above-Average |
| Dividend Champions | 57 | Average |
(Source: DK Research Terminal)
CSCO’s risk-management consensus is in the top 6% of the world’s highest quality companies and similar to that of such other blue-chips as
- Colgate-Palmolive (CL) – dividend king
- Lowe’s (LOW) – dividend king
- 3M (MMM) – dividend king
- Texas Instruments (TXN)
- Taiwan Semiconductor (TSM)
- adidas AG (OTCQX:ADDYY)
- Allianz SE (OTCPK:ALIZY)
The bottom line is that all companies have risks, and CSCO is very good at managing theirs.
How We Monitor CSCO’s Risk Profile
- 29 analysts
- 2 credit rating agencies
- 7 total risk rating agencies
- 36 experts who collectively know this business better than anyone other than management
- and the bond market for real-time fundamental risk assessments
When the facts change, I change my mind. What do you do sir?” – John Maynard Keynes
There are no sacred cows at iREIT or Dividend Kings. Wherever the fundamentals lead we always follow. That’s the essence of disciplined financial science, the math behind retiring rich and staying rich in retirement.
Bottom line: It’s Finally Time To Buy This High-Yield Tech Utility
I’m not a market timer and I’m NOT saying that CSCO is done falling.
No one knows when the market will finally bottom, or if it already has.
| Time Frame | Historically Average Bear Market Bottom |
| Non-Recessionary Bear Markets Since 1965 | -21% |
| Median Recessionary Bear Market Since WWII | -24% |
| Non-Recessionary Bear Markets Since 1928 | -26% |
| Bear Markets Since WWII | -30% |
| Recessionary Bear Markets Since 1965 | -36% |
| All 140 Bear Markets Since 1792 | -37% |
| Average Recessionary Bear Market Since 1928 | -40% |
| (Sources: Ben Carlson, Bank of America, Oxford Economics, Goldman Sachs) |
If we avoid recession then we might have already bottomed.
If we don’t avoid recession (75% of Fortune 500 CEOs expect a mild recession next year) then we might have a bit more to drop.
If inflation comes down faster than expected, then the Fed has a decent shot at a soft landing.
If inflation stays high then the Fed might have to hike to 4% or even more (Deutsche Bank thinks the Fed will go to 5% to 6%).
Nobody can predict interest rates, the future direction of the economy, or the stock market. Dismiss all such forecasts and concentrate on what’s actually happening to the companies in which you’ve invested.” – Peter Lynch
But here’s what I can tell you with very high confidence.
No matter what happens with inflation, interest rates, or the economy in 2022 and beyond, Cisco will endure and likely thrive.
This AA-rated company has $14 billion more cash than debt and is generating $14 billion in free cash flow per year.
44% of sales are now recurring revenue, making this tech utility business model relatively recession-resistant.
Cisco suffered a setback in Q1, thanks to supply chain disruptions in China.
But Cisco’s demand remains strong, and supply is the issue, not future growth prospects.
Cisco isn’t an exciting business, but it’s a boring and beautiful one.
It’s not a risk-free company, those don’t exist. But it’s risk management is the stuff of legend, in the top 15% of its peers and in the top 4% of the world’s greatest companies.
Cisco isn’t a hyper-growth tech legend, and it’s not going to make you ungodly rich in the coming decades.
But it can potentially deliver market-beating 13% annual returns over the next three to five years, 50% more than the S&P consensus.
And at just 8.5X cash-adjusted earnings, CSCO is 14% historically undervalued, representing a classic Buffett-style “wonderful company at a fair price”.
In fact, for an Ultra SWAN company like this, I consider CSCO’s current valuation a wonderful price, making it a potentially good buy and not far from a strong buy.
If you are looking for a very safe 3.5% yield you can rely on to grow every year, no matter what the economy does, consider Cisco.
If you want to earn double-digit returns in the medium and long-term with very low (0.55%) fundamental risk, consider Cisco.
If you’re looking to make your own luck on Wall Street, then Cisco is a reasonable and prudent choice.
In a world of high uncertainty and peak fear, there is a lot to love about one of the greatest dividend stocks on earth.