Japaul Gold Leads Market Gainers with 8.70% Gain

Investor sentiment was less negative today as the market breadth advanced from 0.75x to 0.83x. 15 stocks gained at price, led by JAPAUL GOLD (8.70%) and NAHCO (7.39%), while 18 stocks declined, led by GUINNESS (-9..91%) and TRIPPLEG (-9.72%).

Brent Crude prices climbed after OPEC forecasted an increase in this year’s demand recovery, predicting the market will be able to absorb the extra supply from the planned relaxation of oil production cuts over the next few months.

The S&P 500 hit a record high on Tuesday and the Nasdaq jumped as investors flocked to technology-related stocks after the United States’ pause in the rollout of Johnson & Johnson’s COVID-19 vaccine sparked fears of a delay in a broader economic rebound.

Market Snapshot

  • JAPAUL GOLD Leads Market Gainers with 8.70% Gain
  • US Stocks S&P 500, NASDAQ up as tech stocks rise after J&J vaccine paus
  • Brent Crude Price Rises Following OPEC’s Boosted Forecast
  • NAFEX Appreciates to ₦409.38/1$

Emirates Milestone Flight EK2021 Highlights Industry Readiness For Travel Rebound

Emirates’ one-of-a-kind flight EK2021 proudly made a journey across the different emirates this week, to signal the aviation industry’s readiness for a travel rebound. It was also to celebrate the UAE’s remarkable vaccination programme that has administered close to 9 million vaccines doses to date.

The special flight, which carried a fully vaccinated crew and passengers on board, was unprecedented in the industry in scale. With close to 400 fully vaccinated customers onboard, the flight illustrates confidence and undiminished excitement for air travel.

Emirates Milestone Flight EK2021 Highlights Industry Readiness For Travel Rebound

EK2021 was also supported by fully vaccinated teams across the aviation eco-system, from onboard crew to ground staff, demonstrating the readiness of the UAE’s aviation eco-system to support the safe rebound of air travel.

In spite of the pandemic, the UAE has maintained its status as a leading global aviation hub and it will continue to grow its position as a hub for passengers and cargo traffic by investing in innovations and close collaborations with all stakeholders. Onboard EK2021 was a group of senior officials from key aviation and health sector entities hosted by Emirates.

His Highness Sheikh Ahmed bin Saeed Al Maktoum, Chairman and Chief Executive, Emirates Airline & Group said:

“The UAE’s rapid pace and progress in vaccinating our population is a testament of our leadership’s vision and commitment to safeguard our communities and manage the pandemic by adopting the appropriate measures to protect both nationals and residents.

Today’s flight is a showcase of the combined efforts and dedication of all stakeholders in supporting the vaccination programme, and the implementation of protocols in the past 12 months to ensure a safe travel journey, stimulate passenger traffic and set the groundwork for the ramp-up of air travel in the near future.

Emirates continues to support the national vaccination programme and we are pleased with the progress made within the group in vaccinating our employees.”

The special flight was operated with Emirates’ newest A380 aircraft which featured the airline’s brand-new Premium Economy seats and refreshed cabin interiors across every cabin class. First and Business Class customers were able to safely network and mingle in the iconic A380 Onboard Lounge.

Combining the most advanced aviation technology and an inspired cabin design, The A380 remains a customer favourite for its unmatched comfort and spaciousness.

This month, Airbus launched a travel companion app called “Tripset”. The application aggregates and provides flight and travel information to ease and restore passenger’s trust in their end-to-end journey when travelling by air during the COVID-19 pandemic. Providing passengers with the latest and most relevant travel conditions, restriction and health requirements in place, without having to consult a variety of sources.

Tripset is part of Airbus’ continuing commitment, alongside airlines, industry partners and regulatory agencies, to encourage the flying public to keep trust in air travel, supporting the safe and well-coordinated return to flight, which is essential for economic recovery from COVID-19.

On the ground, passengers checked in using the latest biometric technologies for a seamless journey across multiple touchpoints. Biometric touchpoints were recently expanded to include over 18 check-in desks and 15 boarding gates at the airport. As a result, customers across all classes enjoyed seamless biometric entry to experience the First and Business Class lounge at DXB.

All EK2021 passengers were provided rapid COVID-19 PCR tests, facilitated by Pure Health. Pure Health, the largest integrated healthcare solutions provider in the UAE, has facilitated the administration of up to 4 million PCR tests at Dubai Airports to date. It has also played a vital role in providing COVID-19 testing support to the aviation industry at large, since the start of the pandemic.

As passengers disembarked, they were handed commemorative certificates for taking part in this initiative.

EK2021 was commanded by UAE National Captain Ahmed Al Obeidli, First Officer Ramon Wilde and the flight deck crew were supported by Captain Ricky Garala. All proceeds for EK2021 have been donated to the Emirates Airline Foundation, the airline’s non-profit charity organisation which supports projects around the world aimed at improving the quality of life for disadvantaged children around the world.

Real Household Consumption Expenditure Grew by 0.81% in 2020 – NBS

Household final consumption expenditure, in real terms, grew by 6.10% and 16.59% in Q3 and Q4 2020, respectively, on a year on year basis, compared to the -1.98% growth in Q3 2019 and -0.41% growth in Q4 2019.

Overall, in 2020, real household final consumption expenditure rose by 0.81% from -1.06% recorded in 2019. On a quarter on quarter basis, real household consumption expenditure grew by 38.85% in Q3 and 20.76% in Q4 2020.

Nigeria's Inflation sustains sprint, rises to 14.89% y/y in November 2020

In Q3 2020, the gross domestic product declined in real terms by -3.62% year-on-year but rose to 0.11% in Q4 2020, ending the trend of two-quarters of negative growth. For annual 2020, the gross domestic product grew in real terms by -1.92% year-on-year, slower than 2.27% recorded in 2019, and 1.91% recorded in 2018.

In nominal terms, household final consumption expenditure grew by -1.83% in Q3, and -0.71% in Q4 2020, resulting in an annual growth rate of -1.48%. The annual growth rate was -11.33% points slower than recorded in the previous year.

On a quarter on quarter basis, growth was recorded at 23.04% in Q3, and 7.68% in Q4 2020, compared to the preceding year’s 11.74%, and 6.46% in the corresponding quarters. Household consumption accounted for 63.63% of real GDP at market prices in Q3 2020, and even higher at 70.45% in Q4 2020.

Growth in Consumption Components, 2019, 2020  (Real), Percent,%)    
2019 2020
  Q1 Q2 Q3 Q4 Q1 Q2 Q3 Q4
YoY
Households -2.68 0.75 -1.98 -0.41 -4.86 -18.11 6.10 16.59
NPISH -3.25 7.84 53.77 7.92 -0.38 174.87 289.76 418.54
Government 8.88 0.14 2.26 22.38 6.80 148.29 99.18 12.13
Individual -41.59 -28.86 -33.32 -19.61 -1.81 158.30 106.49 15.75
Collective 52.31 15.70 24.09 47.85 9.65 144.99 96.78 10.93
2019 2020
Q on Q Q1 Q2 Q3 Q4 Q1 Q2 Q3 Q4
Households -20.47 6.33 7.18 9.89 -24.03 -8.48 38.85 20.76
NPISH 23.68 -56.40 45.71 37.37 14.17 20.29 106.61 82.75
Government -4.04 -5.84 2.19 32.54 -16.26 118.90 -18.02 -25.39
Individual -36.96 -5.85 2.15 32.58 -22.99 147.68 -18.34 -25.68
Collective 15.92 -5.84 2.20 32.53 -14.03 110.40 -17.91 -25.29

Growth in Consumption Components, 2019, 2020  (Nominal), Percent,%)  
2019 2020
  Q1 Q2 Q3 Q4 Q1 Q2 Q3 Q4
YoY
Households 7.37 15.00 7.37 10.07 8.15 -10.84 -1.83 -0.71
NPISH 0.55 11.38 57.80 10.75 2.23 180.28 167.64 12.18
Government 13.17 3.43 4.94 25.59 9.61 153.17 104.41 15.07
Individual 13.20 3.45 4.92 25.60 5.19 163.38 111.91 18.79
Collective 13.16 3.43 4.95 25.59 11.06 149.81 101.94 13.84
2019 2020
Q on Q Q1 Q2 Q3 Q4 Q1 Q2 Q3 Q4
Households -15.14 9.03 11.74 6.46 -16.61 -10.12 23.04 7.68
NPISH 24.48 -55.84 45.71 38.26 14.91 21.07 39.14 -42.05
Government -3.42 -4.62 2.19 33.40 -15.71 120.32 -17.49 -24.90
Individual -3.39 -4.62 2.15 33.44 -19.10 138.81 -17.81 -25.20
Collective -3.43 -4.61 2.21 33.39 -14.60 114.55 -17.38 -24.80

Not-for-Profit-Institutions-Serving-Households (NPISH) Consumption

Final consumption expenditure by non-profit institutions serving households recorded growth rates of 289.76% in Q3 and 418.54% in Q4 2020, year on year in real terms. For annual 2020, growth in real expenditure for this component was recorded at 212.36% year on year. Quarter on quarter, growth in real NPISH expenditure stood at 106.61% in Q3 but dropped to 82.75% in Q4 2020. This expenditure component accounted for 1.30% of real GDP expenditure at market price in Q3 and a share of 2.19% in Q4 2020.  For 2020, it accounted for 1.24% of total real GDP expenditure at market prices. 

General Government

In Q3 and Q4 2020, real general government expenditure grew by 99.18% and 12.13% respectively, compared to 2.26% and 22.38% in 2019. On an annual basis, real growth for general government expenditure in 2020 stood at 61.58% compared to 8.78% in 2019. Quarter on quarter, growth was recorded at -18.02% and -25.39% in Q3 and Q4 2020 respectively.

In nominal terms, government expenditure grew by 104.41% in Q3 and 15.07% in Q4 2020 resulting in an annual nominal growth rate of 65.52% in 2020. Government expenditure, however, grew more rapidly in 2020 than in 2019 by 53.35% points. In 2020, this component accounted for 9.40% of total real GDP expenditure at market price.

Gross Fixed Capital Formation (GFCF)

Real GFCF recorded growth in the third and fourth quarters of 2020 at -6.57% and -1.08% year-on-year respectively. On an annual basis, real GFCF grew by -7.55%, or by -15.84% points lower than in 2019.

Quarter on quarter, real GFCF grew by 3.25% and 22.83% in Q3 and Q4 2020 respectively. In nominal terms, Q3 and Q4 2020 recorded 21.78% and 36.42% growth rates. GFCF grew by 23.21% nominally in 2020 while accounting for 14.95% of total real GDP expenditure at market prices in 2020. 

Changes in Inventories

Changes in inventories, often regarded as a sign of economic confidence (as firms stock up on products if they anticipate higher future demand), declined by -7.76% and -9.01% in Q3 and Q4 2020 respectively in real terms.

For 2020, this component grew by 5.94% compared to a growth of -26.23% in the previous year. In nominal terms, changes in inventories grew by 0.86% year on year in 2020 but account for less than 1% of total real GDP expenditure at market prices. 

Consumption of Fixed Capital

Consumption of fixed capital is a measure of depreciation of assets and represents the difference between gross domestic product (GDP) and net domestic product (NDP). Growth in consumption of fixed capital in real terms declined by -0.71% in Q3 2020 and by -0.89% in Q4 2020 compared to -44.78% recorded in Q3 2019 and -0.34% recorded in Q4 2019.

The annual growth rate was -1.29% in 2020, better than -23.15% recorded the previous year.  In nominal terms, Q3 and Q4 2020 grew by 6.86% and 13.64% respectively. CFC grew by 7.05% in 2020 compared to 16.33% a year earlier.

Growth in Capital Accumulation in 2019, 2020 (Real), (percent, %)      
2019 2020
YoY Q1 Q2 Q3 Q4 Q1 Q2 Q3 Q4
GFCF 13.71 13.34 -0.13 6.31 4.46 -25.38 -6.57 -1.08
Changes in Inv. -9.20 -49.25 -44.84 -0.08 -4.18 59.31 -7.76 -9.01
Cons. of fixed capital -6.69 -42.97 -44.78 -0.34 -2.44 -0.73 -0.71 -0.89
2019 2020
Q on Q Q1 Q2 Q3 Q4 Q1 Q2 Q3 Q4
GFCF -0.14 11.17 -17.46 16.02 -1.88 -20.58 3.35 22.83
Changes in Inv. 6.28 -41.82 -13.70 87.24 1.92 -3.27 -50.04 84.71
Cons. Of fixed capital -12.71 -36.93 -11.47 104.48 -14.55 -35.83 -11.45 104.10

Growth in Capital Accumulation in 2019, 2020 (Nominal), (percent, %)    
2019 2020
Y on Y Q1 Q2 Q3 Q4 Q1 Q2 Q3 Q4
GFCF 70.89 54.07 30.21 38.13 37.64 -1.76 21.78 36.42
Changes in Inv. 10.74 10.13 15.05 13.02 9.87 -3.49 -6.68 4.34
Cons. of fixed capital 13.80 23.77 15.16 12.73 11.87 -3.42 6.86 13.64
2019 2020
Q on Q Q1 Q2 Q3 Q4 Q1 Q2 Q3 Q4
GFCF 7.70 19.42 -8.52 17.40 7.32 -14.77 13.41 31.51
Changes in Inv. 8.49 13.95 -10.58 2.24 5.47 0.10 -13.54 14.31
Cons. Of fixed capital -10.89 23.52 -8.27 11.65 -11.57 6.64 1.50 18.73

Exports of Goods and Services

In the third and fourth quarters of 2020, real exports grew by -42.05% and -57.79%, year on year, resulting in an annual growth rate of -26.96%, or 41.94% points lower than 14.98% recorded in 2019. Quarter on quarter, however, growth in real exports remained negative from Q1 2020 to Q4 2020.

In nominal terms, exports in goods and services fell by -40.62% in Q3 and -35.96% in Q4 2020 to reach an annual growth rate of -34.24% in 2020 compared with 3.53% in 2019.

Imports of Goods and Services

As with exports, imports of goods and services also declined in real terms, recording -22.74% in Q3 and -39.93% in Q4. On an annual basis, however, the real growth of imports was worse than in 2019, at -23.30% in 2020 compared to 27.26% in the previous year. On a quarter on quarter basis, imports grew by 16.29% in Q3 but declined -3.48% in Q4 2020.

Nominal imports of goods and services fell during the three quarters (Q2, Q3 & Q4 2020), recording -22.23% in Q2, -4.54% in Q3, and -25.54% in Q4 2020, year on year, to give an annual growth rate of -11.38%. This was -38.97% points lower than the annual growth rate of 2019. Quarter on quarter, nominal imports rose in Q3 by 22.16% but declined in Q4 2020 to -3.15 %. 

Net Balance of Trade

Due to declining rates of growth in exports and imports in 2020, the growth in the net balance of trade (or net exports) was negative in Q3 and Q4 2020. On a year on year basis, the net trade balance recorded a -52.39% growth rate in real terms in Q3 and a -72.61% growth rate in Q4.

This resulted in an annual growth rate of -29.55% in real terms. On a quarter on quarter basis, the net trade balance grew by -30.43% and -53.90% in Q3 and Q4 2020 respectively. This component accounted for 13.25% of total real GDP expenditure at market prices in 2020.

Growth in Trade and Services in 2019, 2020 (Real), (percent, %)      
2019 2020
  Q1 Q2 Q3 Q4 Q1 Q2 Q3 Q4
Y on Y
Exports 16.84 19.61 11.01 14.10 15.49 -13.40 -42.05 -57.79
Imports 34.13 57.71 0.02 30.37 9.08 -33.88 -22.74 -39.93
Trade Balance 7.08 0.00 17.94 3.40 20.02 3.22 -52.39 -72.61
2019 2020
Q on Q Q1 Q2 Q3 Q4 Q1 Q2 Q3 Q4
Exports -4.52 -2.10 27.85 -4.52 -3.36 -26.59 -14.45 -30.46
Imports -0.32 5.85 -0.47 24.14 -16.59 -35.84 16.29 -3.48
Trade Balance -7.28 -7.73 50.84 -19.87 7.62 -20.65 -30.43 -53.90

Growth in Trade and Services in 2019, 2020 (Nominal), (percent, %)      
2019 2020
  Q1 Q2 Q3 Q4 Q1 Q2 Q3 Q4
Y on Y
Exports -0.76 3.42 6.44 4.84 -9.22 -49.78 -40.62 -35.96
Imports 34.59 58.32 0.31 30.48 11.45 -22.23 -4.54 -25.54
Trade Balance -1640.97 -481.96 -20.92 105.67 74.53 51.16 163.81 -9.97
2019 2020
Q on Q Q1 Q2 Q3 Q4 Q1 Q2 Q3 Q4
Exports 0.75 2.21 12.72 -9.68 -12.76 -43.45 33.26 -2.59
Imports -0.26 5.88 -0.48 24.15 -14.81 -26.12 22.16 -3.15
Trade Balance -3.23 17.08 -35.64 182.03 -17.88 1.40 12.33 -3.75

100 Years On – See Why Mercedes-Maybach Is The Pinnacle Of Luxury

“To present the best of the best”: that was the ambition voiced by Karl Maybach and his father Wilhelm when they debuted the Maybach 22/70 HP W 3 a century ago – planting the seed for Mercedes-Maybach to become one of the most unique and exclusive automotive brands today.

The philosophy expressed at Berlin’s motor exhibition that day has remained at the core of the brand ever since.

100 years on – why Mercedes-Maybach is the pinnacle of luxury and creative empowerment Brandspurng

Over the decades, as royalty, world leaders, movie stars and sports champions have travelled in Mercedes-Maybach vehicles, the double M emblem has come to signify the pinnacle of technical innovation and sophisticated luxury. It is a seal of passion and creative empowerment. Maybach’s words today represent not just the “best” products but the “best” in society.

Watch the 100 Years of Maybach video below;

From the moment the W 3 – Maybach Motorenbau GmbH’s first serial production model – was unveiled in September 1921, a legend had been born. From the four-wheel brakes (the first German car to have such a function) and planetary gearbox complete with the six-cylinder engine (enabling all speeds to be managed with a single gear) to the sumptuous wood and leather interiors, the design was boundary-breaking.

100 Years On – See Why Mercedes-Maybach Is The Pinnacle Of Luxury-Brand Spur Nigeria

The car – resembling a work of art on wheels – delighted the public. However, steadfast longevity requires constant evolution.

Daimler acquired Maybach Motorenbau GmbH in 1961 and, in 2002, ushered in a new era with the Maybach 62.

Coinciding with its centenary, Mercedes-Maybach has unveiled two new models: the S-Class, which represents automotive luxury now more than ever thanks to numerous digital innovations and technical finesse, and the GLS SUV – setting the highest standards of modernization in the SUV division.

100 Years On – See Why Mercedes-Maybach Is The Pinnacle Of Luxury-Brand Spur Nigeria

Nothing is left unconsidered in the design of each vehicle, and Mercedes-Maybach is deep in the process of cultivating its next remarkable and unique experience with its first fully electric vehicle – details of which will be revealed in the coming months.

“Mercedes-Maybach is the pinnacle of automotive excellence at Mercedes-Benz,” says Britta Seeger, Member of the Board of Management of Daimler AG and Mercedes Benz AG

Mobile Data Revenue Falls Below US$1 Per Gigabyte As 5G Uplift Proves Elusive

0

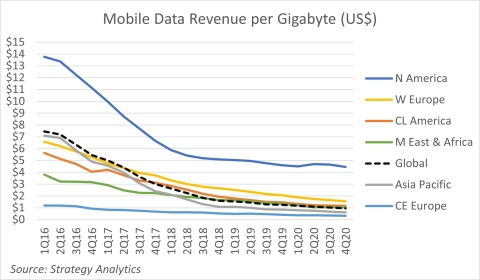
Mobile operators are still struggling to create ARPU uplift from network upgrades as mobile data revenue fell below US$1 per Gigabyte for the first time in Q4 2020.

According to the latest report from Strategy Analytics, “Mobile Data Revenue per Gigabyte Falls Below US$1 as 5G Ramps Up”, weak service revenue growth in the strong 5G markets of South Korea and China paint a challenging picture for consumer 5G value creation across the globe in 2021.

Figure 1. Mobile Data Revenue per Gigabyte in $USD (Source: Strategy Analytics, Inc.)Figure 1. Mobile Data Revenue per Gigabyte in $USD (Source: Strategy Analytics, Inc.)

Building on data from Strategy Analytics’ Wireless Operator Performance Benchmarking database, which tracks the operators accounting for 82% of global subscriptions, global cellular data traffic increased by 35% year-on-year in Q4 2020, but total mobile service revenue increased by just 0.6%. Key findings from the report include:

  • Subscriptions used on 5G networks increased from 2.1% in September 2020 to 3.0% in December 2020, with China accounting for 80% of global totals;
  • China and India have a significant volume influence on global revenue per Gigabyte, averaging just US$0.55 and US$0.10 respectively in Q4;
  • Speed-based tiered unlimited data plans in Finland have helped lift average revenue per user (ARPU) 17% over the last five years, compared with a 15% decline across Western Europe.

Phil Kendall, Director, Service Provider Group and report author notes “Volume-based data pricing is going to cause a headache for many operators conditioned to utility-based revenue or cost per unit thinking. With the capacity gains offered by 5G diluting value per Gigabyte, operators need ‘more for more’ pricing that offers revenue uplift through better experiences and richer content rather than through more data.”

Josie Sephton, Director, Teligen, added “With many consumers picking price plans that fit their budget first and their data usage requirements second, operators need to educate users away from high-volume low-cost plans and the idea that 150GB is meaningfully better than 100GB. We are in a data pricing merry-go-round that needs to be reset.”

CBN To Commence Enrolment Of All DFIs, MFBs, PMBs And FCs On The CRMS Platform

As part of the efforts to promote a safe and sound financial system in Nigeria, the CBN introduced the CRMS to improve credit risk management in commercial, merchant and non-interest banks as well as to prevent predatory borrowers from undermining the banking system.

With the successful implementation of the CRMS in deposit money banks, it has become expedient to commence the enrollment of Other Financial Institutions (OFIs) on the CRMS Platform.

Accordingly, all DFls, MFBs, PMBs and FCs are required to report ALL credit facilities (principal and interest) to the CRMS and to update same on monthly basis. OF Is shall note that Bank Verification Numbers (BVN) and Tax Identification Numbers (TIN) are the only basis for regulatory renditions.

To ensure full compliance, OFls are reminded to conclude the tagging of ALL live credit files for ALL individual and non-individual borrowers with BVN and TIN respectively by May 14, 20271.

Furthermore, the concerned OF Is are advised to acquaint themselves with the Regulatory Guidelines for the Operations of the Redesigned CRMS for Commercial, Merchant and Non-Interest Banks in Nigeria (February 2017) and the additional regulatory guidelines of September 2017.

ScholarX Partners With Airtel To Launch Mobile Learning Platform

ScholarX Technologies Ltd., an EdTech start-up founded in 2016 and headquartered in Lagos, Nigeria has announced a strategic partnership with leading telecommunications services provider, Airtel Nigeria, to launch LearnAM, a new mobile learning platform that provides skills training content to improve learning outcomes.

ScholarX will also receive major support from the GSMA Innovation Fund for Mobile Internet Adoption and Digital Inclusion while leveraging on the expansive retail and digital footprints of Airtel Nigeria to deliver its skill acquisition content.

ScholarX Partners With Airtel To Launch Mobile Learning Platform-Brand Spur Nigeria

According to ScholarX, the grant received from the GSMA Innovation Fund for Internet Adoption and Digital Inclusion will help fund key components in the initial phase of the project including Platform Development, Content Development & Sourcing, and Early User Adoption.

Commenting on the LearnAm initiative, Bola Lawal, Co-founder and CEO, ScholarX, said:

“The ScholarX team expresses profound appreciation to Airtel Nigeria and the GSMA Innovation Fund, funded by the Foreign, Commonwealth & Development Office (FCDO). Through the GSMA fund, we are now able to embark on our quest to connect millions of unconnected people in Africa to the Internet and help them get trained invaluable skills for the new Digital Economy.”

“LearnAM provides audio and visual content to improve digital and vocational skills of Africans so they can access decent work. It employs a 360 approach as it provides learning opportunities, assessment to measure competency, and a marketplace that connects users to jobs, customers and apprenticeships.”

“We are committed to building a more skilled workforce focusing on young people, and not-so-young adult population who are looking to upskill or simply improve their standard of living,” he said.

Commenting on the partnership, the Chief Commercial Officer of Airtel Nigeria, Dinesh Balsingh, said Airtel is pleased to partner with ScholarX, the GSMA Innovation Fund Grantee, in creating platforms and opportunities that will empower and equip young Nigerians with the skills they require to become more successful in their personal and professional endeavours.

“At Airtel, we are passionate about improving the quality of education and also helping Nigerians to gain the required skills they need to become self-sufficient and also to realize their dreams. We will continue to explore innovative partnerships that will transform lives and help more people to become successful.”

The initial version of LearnAM app has been developed on KaiOS and it will be available on affordable “smart-feature phones” and with content in local dialects such as Pidgin English, Yoruba, Igbo and Hausa.

A key feature of LearnAM is a Device Financing Program that enables individuals and members of Cooperative societies to procure a device preloaded with the LearnAM app bundled with services from strategic partners on instalment after an initial deposit.

Details of this program are currently being finalized with the Financing and Agent Network Partners. While the prototype of the LearnAM KaiOS app is now available on the KaiOS app store, the official launch of the platform will be in June 2021.

SurveyMonkey Launches AI-Powered Brand And Industry Tracking Solutions

0

SurveyMonkey a leader in agile software solutions for market research, customer experience, and survey feedback, today announced the availability of SurveyMonkey Brand Tracker and SurveyMonkey Industry Tracker, two new solutions that enable brands and financial services firms to continuously monitor shifts in market perception and quickly react to fuel growth.

Digital transformation, the onset of the pandemic, and rapidly changing buyer behavior have accelerated the pace of change in business so much that traditional market research firms are unable to provide the same value they once did. SurveyMonkey’s latest tracker offerings use technology to deliver always-on insights that help organizations win in hypercompetitive markets.

SurveyMonkey Market Research Solutions allow researchers and finance professionals to gather proprietary data on-demand from over 144 million respondents globally. SurveyMonkey Brand Tracker and SurveyMonkey Industry Tracker use robust AI and machine learning capabilities to make it easy to launch methodologically sound trackers, monitor industry and brand performance, and uncover business-changing insights at a fraction of the time and cost of traditional agencies.

The technology paired with SurveyMonkey’s Expert Services team enables a flexible delivery model that provides the right level of service to meet each organization’s unique needs without the overhead cost or extended timelines of agencies.

SurveyMonkey Brand Tracker enables companies to continuously measure brand performance, including tracking behavior trends and consumer habits across multiple markets, assessing campaign effectiveness, and conducting competitive analysis.

The Brand Tracker uses technology to make it even easier for organizations to deploy one of the most valuable use cases for brands already running agile market research with SurveyMonkey Market Research Solutions. Leading sustainable footwear and apparel brand Allbirds relies on the solution to run timely surveys on-demand at a fraction of the cost of their previous agency.

Instead of receiving quarterly reports produced by a third party, Allbirds uses Market Research Solutions to continuously monitor its brand health in key markets, collecting more than 14,000 responses each year. Prior to entering a new market, Allbirds also runs studies to establish baseline brand awareness, understand how local consumer segments perceive the brand, and identify what people expect to pay for their products in that area.

“Brand awareness is a key component of our growth and expansion strategy. It’s critical we have an up-to-date understanding of our public perception and marketing funnel metrics at all times to understand our existing customers and identify new opportunities,” said Jen Jammalamadaka, associate director, global brand marketing at Allbirds. “SurveyMonkey’s technology empowers our teams to get the business-driving insights we need to make informed decisions quickly.”

SurveyMonkey Industry Tracker allows investment and finance research professionals to understand changing market dynamics. Traditional financial reports and alternative data (like transaction data) are often either not proprietary or not timely. To understand rapidly changing buyer preferences and competitive dynamics, SurveyMonkey Industry Tracker offers an agile approach to monitor industries and surface timely insights.

It allows researchers to measure shifts in consumer and buyer sentiment and preference—such as monitoring changes in gym membership and e-commerce vs. in-person shopping—and assess the competitive landscape quickly and as often as they require. The proprietary insight gained through an Industry Tracker equips finance research professionals to make stronger strategic investment decisions and stay ahead of the competition.

“COVID-19 accelerated an existing trend of digital-first research to keep up with rapid changes in buyer demands and competitive dynamics. We saw market perception shift dramatically many times last year and not on the schedule a traditional research agency provides reports,” said Priyanka Carr, general manager of Market Research Solutions at SurveyMonkey. “We’re thrilled to launch SurveyMonkey Brand Tracker and SurveyMonkey Industry Tracker. These two solutions show the growing value of replacing slow agencies with agile technology that delivers insights on-demand, allowing businesses to rapidly react and adapt.”

Key product features of both SurveyMonkey Brand Tracker and SurveyMonkey Industry Tracker include:

  • Longitudinal Research Platform: Access to an always-on statistical analysis platform, where users can easily compare brand funnel metrics wave-over-wave and measure what changed, when, and why.
  • AI-Powered Insights: Users don’t have to manually sift through hundreds of filters to discover hidden insights. AI-powered insights instantly serve up statistically significant wave-over-wave changes to key metrics such as category perception and brand usage, highlighting the demographic and behavioral segments that shift the most.
  • Expert Services: SurveyMonkey’s team of research experts will help customize the trackers according to specific needs and in line with industry-proven methodology. The team is available for users who need to scale programs globally or dig deeper into data.
  • Data Consistency: SurveyMonkey uses the same quality data sources and demographic balancing each wave, excluding respondents from prior waves, so users can be confident their results are accurate and representative.
  • Custom Dashboards: Users can create custom dashboards with advanced data visualizations that they can share with their teams and other stakeholders to drive decision-making throughout the organization. The dashboards allow users to combine data from multiple markets, tailor the visualizations, and personalize the commentary. Dashboards can be shared with a password-protected link or exported into presentation-ready formats.

Expectations About When Life Will Return To Pre-COVID Normal Vary Widely Across The World

0

A new Ipsos survey for the World Economic Forum finds that, on average across 30 countries and markets surveyed, 59% expect to be able to return to something like their normal pre-COVID life within the next 12 months, including 6% who think this is already the case, 9% who think it will take no more than three months, 13% four to six months, and 32% seven to 12 months (the median time).

About one in five think it will take more than three years (10%) or that it will never happen (8%).

Views on when to expect a return to normal vary widely across countries: Over 70% of adults in Saudi Arabia, Russia, India, and mainland China are confident their life will return to pre-COVID normal within a year.

In contrast, 80% in Japan and more than half in France, Italy, South Korea, and Spain expect it will take longer.

At a global level, expectations about how long it will take before one’s life can return to its pre-COVID normal and how long it will take for the pandemic to be contained are nearly identical. These findings suggest that people across the world consider that being able to return to “normal” life is entirely dependent on containing the pandemic.

An average of 45% of adults globally say their mental and emotional health has gotten worse since the beginning of the pandemic about a year ago. However, almost as many say it has improved since the beginning of the year (23%) as say it has worsened (27%).

The survey was conducted among more than 21,000 adults under the age of 75 between February 19, 2021 and March 5, 2021 on Ipsos’ Global Advisor online platform.

How Long Before Coronavirus Pandemic Is Contained?

Similar to life returning to pre-COVID normal, 58% on average across all markets surveyed expect the pandemic to be contained within the next year, including 13% who think this is already the case or will happen within 3 months, 13% between four and six months and 32% between seven and 12 months (the median time in most markets).
Majorities in India, mainland China, and Saudi Arabia think the pandemic is already contained or will be within the next 6 months. In contrast, four in five in Japan and more than half in Australia, France, Poland, Spain, and Sweden expect it will take more than a year.

Change In Emotional And Mental Health Since The Beginning Of The Pandemic About A Year Ago

On average across the 30 countries and markets surveyed, 45% of adults say their emotional and mental health has gotten worse since the beginning of the pandemic about a year ago, three times the proportion of adults who say it has improved (16%)
In 11 countries, at least half report a decline in their emotional and mental health with Turkey (61%), Chile (56%), and Hungary (56%) showing the largest proportions.
Only in mainland China, India, and Saudi Arabia do more adults report an improvement in their emotional and mental health than a decline.

Change In Emotional And Mental Health Since Beginning Of 2021

Adults who say their emotional and mental health has improved outnumber those who say it has worsened by at least 40 percentage points in China (51 points) and India (41 points).
Those who say their mental and emotional health has improved since the start of 2021 are most outnumbered by those who say it has worsened in Hungary (by 30 points), France (29 points), and Italy (26 points).


Inflation In Advanced Economies Remain Below The 2% Threshold

In March 2021, OPEC revised its expectation for oil demand for the year to 96.27 Mbpd (from 96.05 mbpd), while OPEC+ maintained existing production cuts on the supply side at 7.2 million barrels per day.

The decision to maintain production cuts triggered a rally in oil prices, peaking at USD69.95 during the month and settling at USD64 at the end of the month (above the previous months and well above 2020 prices).

While we recognize that the higher oil prices contributed to an uptick in inflation in developed economies like the US (1.68%YoY) and UK (0.46%YoY) in February, we still expect inflation to remain below the 2% threshold in the near term.

In our view, the key risks to inflation would be the acceleration of vaccinations and the consequent reopening of economies. Nonetheless, we believe the suspension of the AstraZeneca vaccine in some European countries due to rising concerns about blood clotting diminishes the odds of hasty reopening of economies.

We also note the inflationary effects of the COVID-19 relief and asset purchase programmes embarked on by governments including the Quantitative Easing Program by the U.S Fed. and the Pandemic Emergency Purchase Program (PEPP) by the European Central Bank.