


It’s been a horrific start to the year for stocks in general, but especially tech stocks.
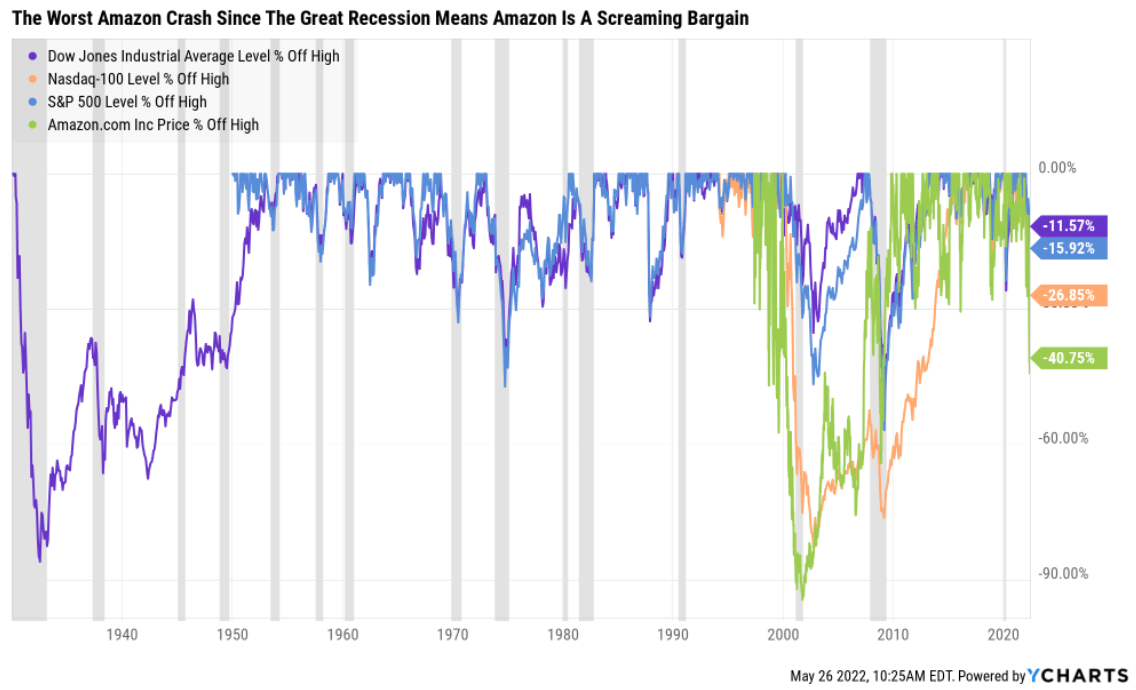
According to Bloomberg 2/3 of the S&P 500 is in a bear market, and half of the Nasdaq is down 50% or more.
Ycharts
Amazon (NASDAQ:AMZN), a quintessential hyper-growth Ultra SWAN is down 41% of its highs, the worst crash since the Great Recession.
- the lowest valuation in seven years
Naturally, Amazon shareholders want to know when the bottom will finally arrive and when it’s time to back up the truck on this legendary growth stock.
While I can’t tell you with confidence when Amazon will finally stop crashing, I can tell you with 80% confidence, that there are five reasons now is almost certainly the time to start buying Amazon more aggressively.
So let’s take a look at the five reasons the market is dead wrong to be so bearish on Amazon and why now might be the time to back up the truck on one of the greatest growth stories in history.
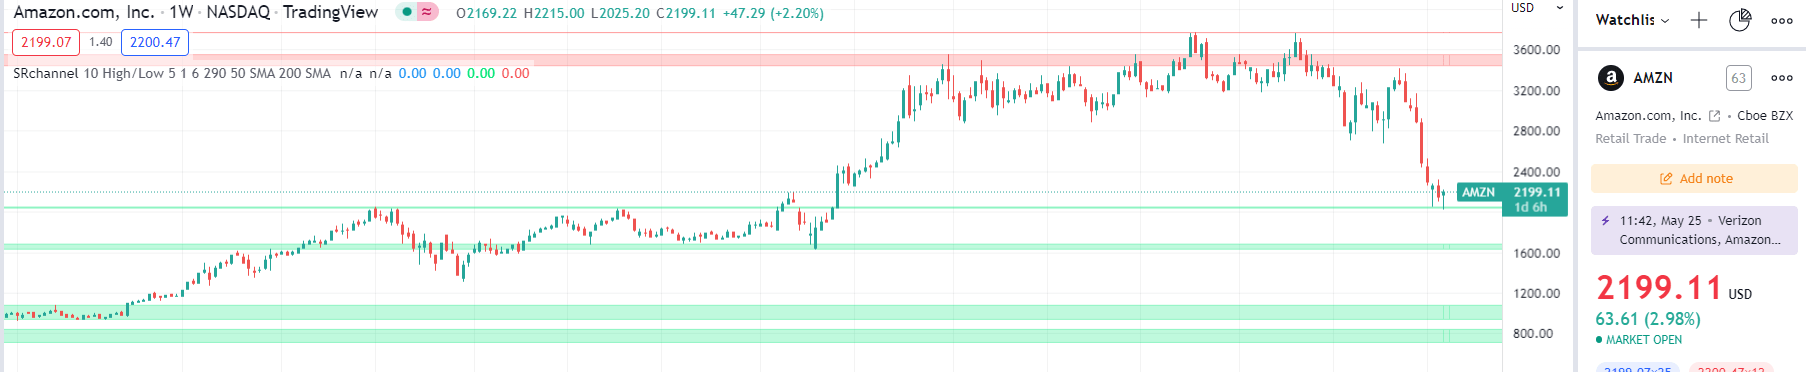
Reason One: Technical Analysis Has Good News For Amazon Bulls
I’m not a technical focused analyst but Amazon did recently bounce off medium strength support, potentially indicating a short-term bottom.
Tradingview.com
Whether or not it continues to lower lows will depend on the broader market and economic conditions, but Amazon’s crash could be nearing its end.

StockTA.com
Recent short-term TA indicators are also becoming bullish, further giving support to the thesis that the worst MIGHT be behind Amazon’s share price.
But of course, I don’t recommend any blue-chip to try to score a quick gain, but to help you retire in safety and splendor.
And that is something Amazon can most assuredly do.
Reason Two: Amazon Is The Whole Package
Here’s the bottom line upfront on Amazon.
Reasons To Potentially Buy AMZN Today
- 97% quality medium-risk 13/13 Ultra SWAN hyper-growth company
- 100% balance safety score
- 45% undervalued (potential ultra value strong buy)
- Fair Value: $3,921.06 (26.0X operating cash flow)
- 14.3X forward cash flow vs 25X to 27X historical
- 15.6X cash-adjusted earnings
- AA stable outlook credit rating =0.51% 30-year bankruptcy risk
- 52nd industry percentile risk management consensus = average
- 19.1% to 40.5% CAGR margin-of-error growth consensus range
- 4.9% to 36% CAGR individual analyst growth range
- 21.7% CAGR median growth consensus
- 5-year consensus total return potential: 34% to 39% CAGR
- base-case 5-year consensus return potential: 37% CAGR (12X S&P consensus)
- consensus 12-month total return forecast: 70% (24.2X OCF, reasonable)
- Fundamentally Justified 12-Month Returns: 82% CAGR
Amazon’s biggest crash since the Financial Crisis has created the lowest valuation in 7 years.
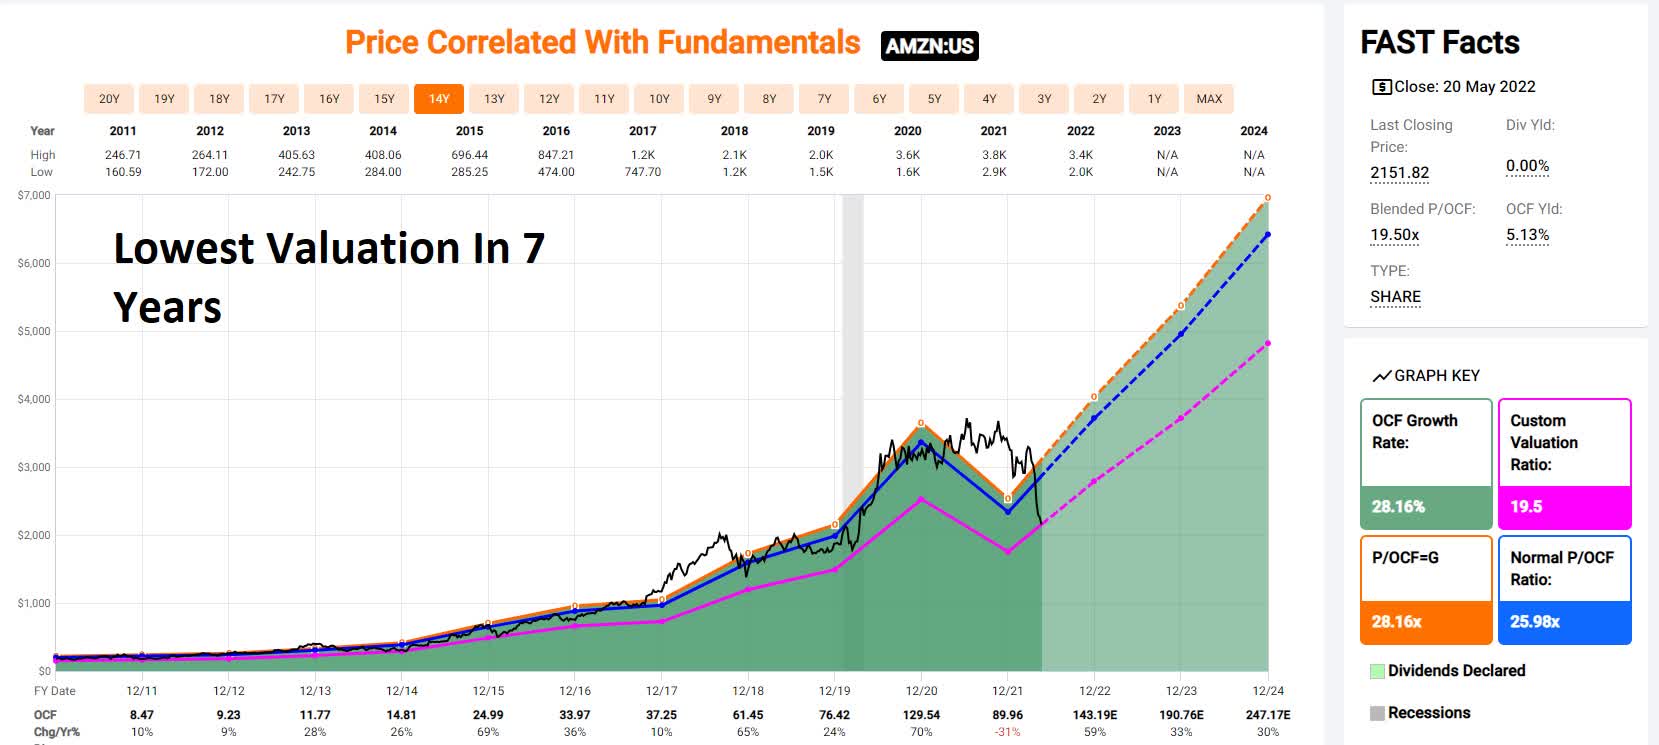
Fast Graphs, FactSet
Amazon’s growth thesis remains firmly intact.
| Metric | 2022 Growth Consensus | 2023 Growth Consensus | 2024 Growth Consensus | 2025 Growth Consensus | 2026 Growth Consensus | 2027 Growth Consensus |
| Sales | 13% | 17% | 16% | 11% | 11% | 12% |
| EPS | -76% | 262% | 59% | 34% | 44% | 29% |
| Operating Cash Flow | 44% | 42% | 23% | 24% | 146% | 18% |
| Free Cash Flow | 244% | 191% | 62% | 48% | 29% | 23% |
| EBITDA | 57% | 25% | 33% | NA | NA | NA |
| EBIT (operating income) | -20% | 86% | 68% | NA | NA | NA |
(Source: FAST Graphs, FactSet)
Analysts are likely not yet pricing in a potential recession in 2023 or 2024, but Amazon’s #1 source of cash flow, AWS, is recession-resistant.
- cloud computing savings companies money
- and is recession-resistant
AMZN Rolling Returns Since June 1997

(Source: Portfolio Visualizer Premium)
AMZN’s average growth rate since 1997 was 26%, and through 2027 analysts expect 27%.
- from bear market bottoms returns as strong as 40% annually over the next 15 years
- 148X return over a 15-year
AMZN 2024 Consensus Total Return Potential

(Source: FAST Graphs, FactSet)

(Source: FAST Graphs, FactSet)
If AMZN grows as analysts expect by 2024 it could deliver almost 200% total returns or 52% annually.
- Buffett-like return potential from a blue-chip bargain hiding in plain sight
AMZN 2027 Consensus Total Return Potential
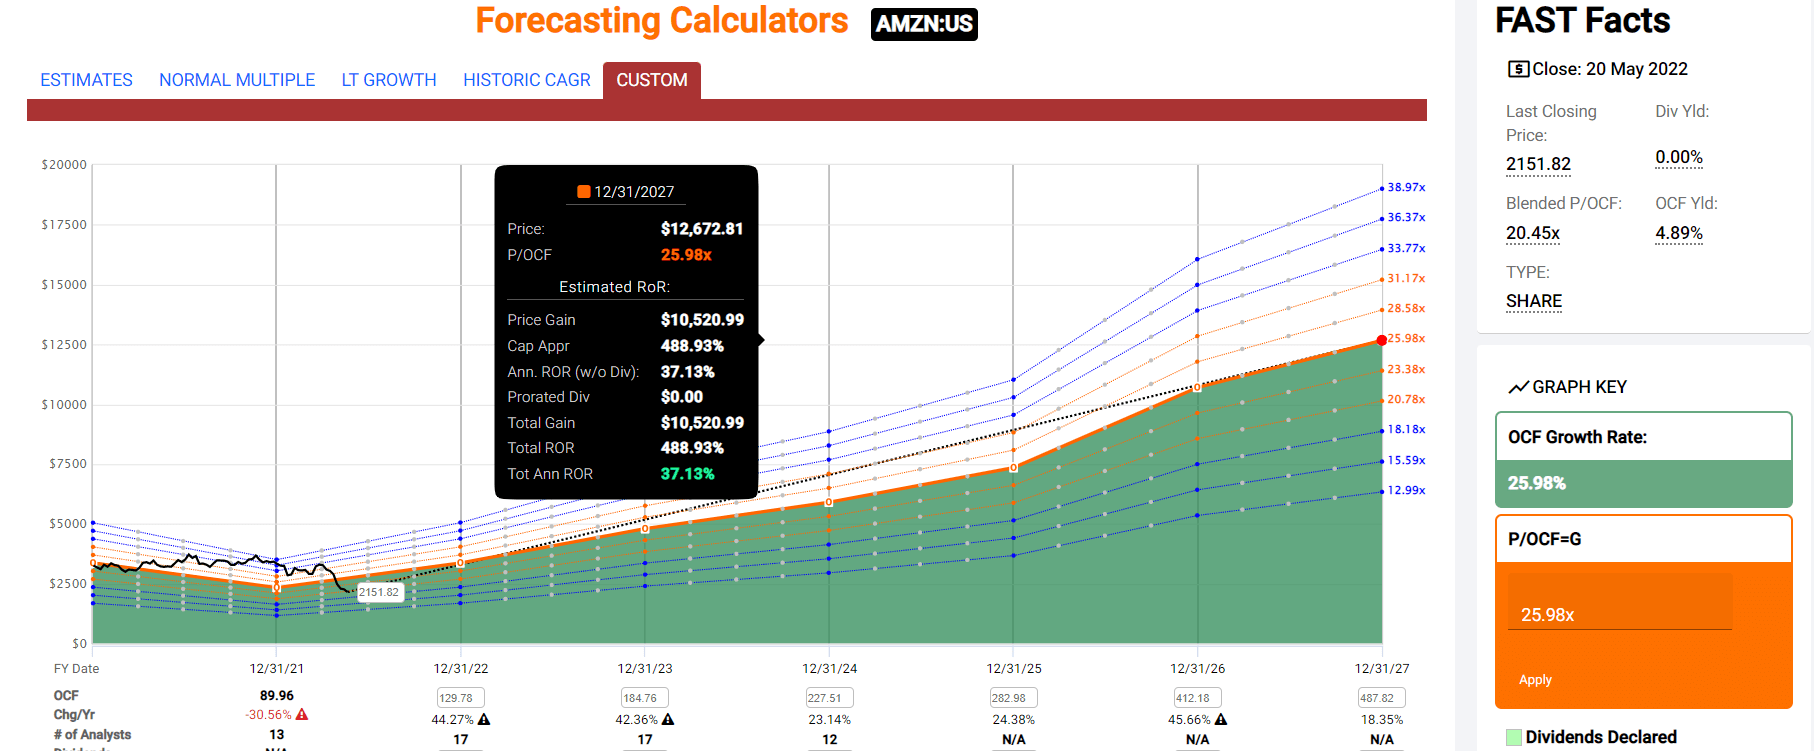
(Source: FAST Graphs, FactSet)

(Source: FAST Graphs, FactSet)
By 2027 if AMZN grows as expected (26% CAGR) and returns to historical fair value, it could deliver almost 500% total returns or 37% annually.
- potential 6X return in 5 years
- 12X the S&P 500
AMZN Long-Term Consensus Total Return Potential
| Investment Strategy | Yield | LT Consensus Growth | LT Consensus Total Return Potential | Long-Term Risk-Adjusted Expected Return | Long-Term Inflation And Risk-Adjusted Expected Returns | Years To Double Your Inflation & Risk-Adjusted Wealth | 10 Year Inflation And Risk-Adjusted Expected Return |
| Adam’s Planned Correction Buys | 4.1% | 19.2% | 23.3% | 16.3% | 13.8% | 5.2 | 3.63 |
| Amazon | 0.0% | 21.7% | 21.7% | 15.2% | 12.6% | 5.7 | 3.29 (Ignoring Valuation) |
| Value | 2.7% | 13.3% | 16.0% | 11.2% | 8.7% | 8.3 | 2.29 |
| High-Yield | 3.1% | 12.7% | 15.8% | 11.1% | 8.5% | 8.5 | 2.26 |
| Nasdaq (Growth) | 1.0% | 13.9% | 14.9% | 10.4% | 7.9% | 9.1 | 2.14 |
| S&P 500 | 1.7% | 8.5% | 10.2% | 7.1% | 4.6% | 15.7 | 1.57 |
| Dividend Aristocrats | 2.2% | 8.9% | 11.1% | 7.8% | 5.2% | 13.8 | 1.66 |
(Sources: Morningstar, FactSet, Ycharts)
- analysts expect AMZN to beat almost all growth investment strategies on Wall Street in the long-term
- including the Nasdaq, aristocrats, and S&P 500
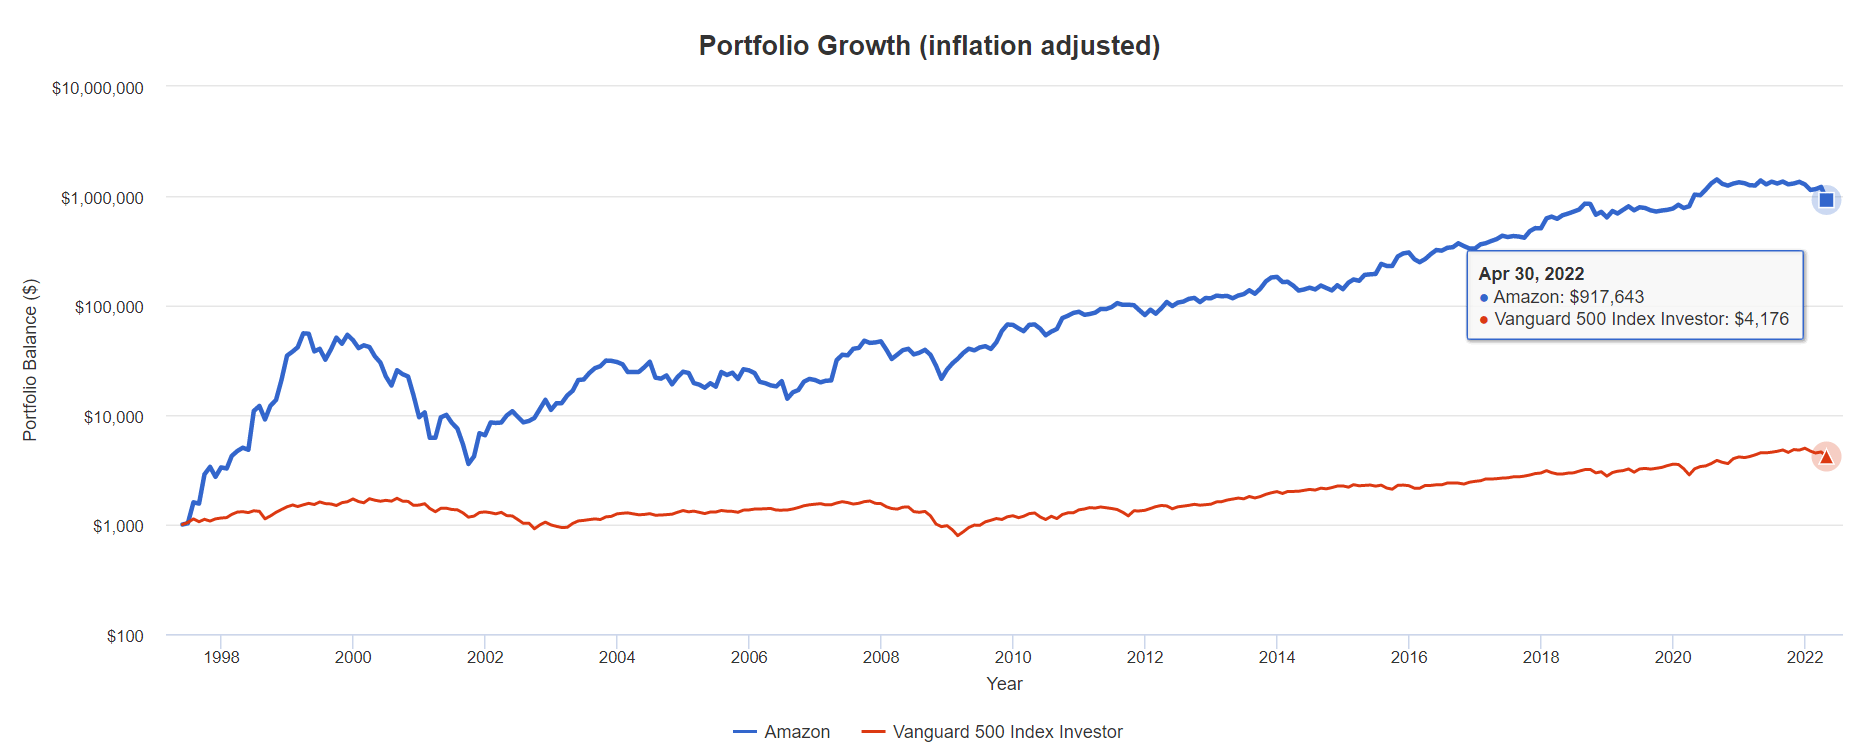
AMZN Total Returns Since June 1997
(Source: Portfolio Visualizer Premium)
(Source: Portfolio Visualizer Premium)
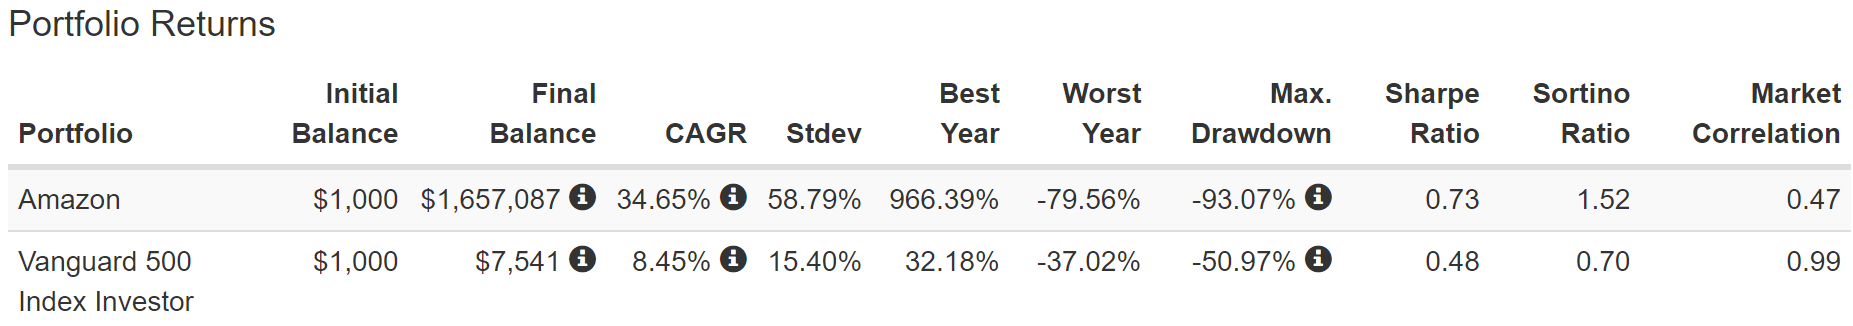
AMZN has delivered 918X inflation-adjusted returns since June 1997, about 230X better than the S&P 500.
What do analysts expect in the future?
Inflation-Adjusted Consensus Return Potential: $1,000 Initial Investment
| Time Frame (Years) | 7.7% CAGR Inflation-Adjusted S&P Consensus | 8.7% PM Inflation-Adjusted Aristocrats Consensus | 19.2% CAGR Inflation-Adjusted AMZN Consensus | Difference Between Inflation Adjusted AMZN and S&P Consensus |
| 5 | $1,445.67 | $1,514.08 | $2,401.43 | $955.76 |
| 10 | $2,089.97 | $2,292.44 | $5,766.87 | $3,676.90 |
| 15 | $3,021.42 | $3,470.93 | $13,848.75 | $10,827.34 |
| 20 | $4,367.98 | $5,255.26 | $33,256.84 | $28,888.86 |
| 25 | $6,314.67 | $7,956.89 | $79,864.02 | $73,549.35 |
| 30 | $9,128.95 | $12,047.36 | $191,787.99 | $182,659.03 |
(Source: DK Research Terminal, FactSet)
Ignoring valuation entirely, if AMZN can only grow as expected for the next 10 years, it could deliver 6X inflation-adjusted returns.
| Time Frame (Years) | Ratio AMZN/Aristocrats | Ratio Inflation-Adjusted AMZN Consensus And S&P Consensus |
| 5 | 1.59 | 1.66 |
| 10 | 2.52 | 2.76 |
| 15 | 3.99 | 4.58 |
| 20 | 6.33 | 7.61 |
| 25 | 10.04 | 12.65 |
| 30 | 15.92 | 21.01 |
(Source: DK Research Terminal, FactSet)
Ignoring valuation entirely, if AMZN grows as expected for a decade it would roughly 3X the S&P 500’s returns.
AMZN Investment Decision Score

DK

(Source: DK Automated Investment Decision Tool)
For anyone comfortable with its risk profile, AMZN is as close to a perfect hyper-growth Ultra SWAN investment as exists on Wall Street.
- 45% discount vs 2% market discount = 43% better valuation
- 120% higher long-term return potential than S&P 500 overtime
- about 4x better risk-adjusted expected return over the next five years
Reason Three: World-Class Quality Built To Thrive In Any Economy
There are many ways to measure safety and quality and I factor in pretty much all of them.
The Dividend Kings’ overall quality scores are based on a 253-point model that includes:
- Dividend safety
- Balance sheet strength
- Credit ratings
- Credit default swap medium-term bankruptcy risk data
- Short and long-term bankruptcy risk
- Accounting and corporate fraud risk
- Profitability and business model
- Growth consensus estimates
- Management growth guidance
- Historical earnings growth rates
- Historical cash flow growth rates
- Historical dividend growth rates
- Historical sales growth rates
- Cost of capital
- GF Scores
- Long-term risk-management scores from MSCI, Morningstar, FactSet, S&P, Reuters’/Refinitiv, and Just Capital
- Management quality
- Dividend friendly corporate culture/income dependability
- Long-term total returns (a Ben Graham sign of quality)
- Analyst consensus long-term return potential
In fact, it includes over 1,000 fundamental metrics including the 12 rating agencies we use to assess fundamental risk.
- credit and risk management ratings make up 41% of the DK safety and quality model
- dividend/balance sheet/risk ratings make up 82% of the DK safety and quality model
How do we know that our safety and quality model works well?
During the two worst recessions in 75 years, our safety model 87% of blue-chip dividend cuts, the ultimate baptism by fire for any dividend safety model.
How does AMZN score on our comprehensive safety and quality models?
AMZN Balance Sheet Safety
| Rating | Dividend Kings Safety Score (162 Point Safety Model) | Approximate Dividend Cut Risk (Average Recession) | Approximate Dividend Cut Risk In Pandemic Level Recession |
| 1 – unsafe | 0% to 20% | over 4% | 16+% |
| 2- below average | 21% to 40% | over 2% | 8% to 16% |
| 3 – average | 41% to 60% | 2% | 4% to 8% |
| 4 – safe | 61% to 80% | 1% | 2% to 4% |
| 5- very safe | 81% to 100% | 0.5% | 1% to 2% |
| AMZN | 100% | NA | NA |
| Risk Rating | Medium-Risk (52nd industry percentile risk-management consensus) | AA Stable outlook credit rating 0.55% 30-year bankruptcy risk | 20% OR LESS Max Risk Cap Recommendation |
Long-Term Dependability
| Company | DK Long-Term Dependability Score | Interpretation | Points |
| Non-Dependable Companies | 21% or below | Poor Dependability | 1 |
| Low Dependability Companies | 22% to 60% | Below-Average Dependability | 2 |
| S&P 500/Industry Average | 61% (61% to 70% range) | Average Dependability | 3 |
| Above-Average | 71% to 80% | Very Dependable | 4 |
| Very Good | 81% or higher | Exceptional Dependability | 5 |
| AMZN | 94% | Exceptional Dependability | 5 |
Overall Quality
| AMZN | Final Score | Rating |
| Safety | 100% | 5/5 very safe |
| Business Model | 90% | 3/3 wide and stable moat |
| Dependability | 94% | 5/5 exceptional |
| Total | 97% | 13/13 Ultra SWAN |
| Risk Rating | 2/3 Medium Risk | |
| 20% OR LESS Max Risk Cap Rec | 5% Margin of Safety For A Potentially Good Buy |
Why I Trust Amazon And So Can You
Section 2 of this video showcases the detailed investment thesis for AMZN.
- including why AWS is likely worth more than Amazon’s market cap today
- so is advertising
- buy AMZN for AWS and get advertising and the rest of the business for free
Earnings Update
| Pre-Earnings | Now | Change | |||
| 2022 OCF | 2023 OCF | 2022 OCF | 2023 OCF | 2022 OCF | 2023 OCF |
| $169.48 | $206.27 | $129.78 | $184.76 | -23.42% | -10.43% |
Amazon’s earnings were disappointing and resulted in significant declines in 2022 and 2023 cash flow estimates.
Amazon’s Profitability Hit by Inflation, Excess Capacity; Guidance Doesn’t Help; FVE Down to $3,850″ – Morningstar
Amazon more than doubled its delivery capacity during the pandemic to take advantage of the greatest demand boom in history.
It now has excess capacity and rising input costs (like Target and Walmart) that are hurting margins temporarily.
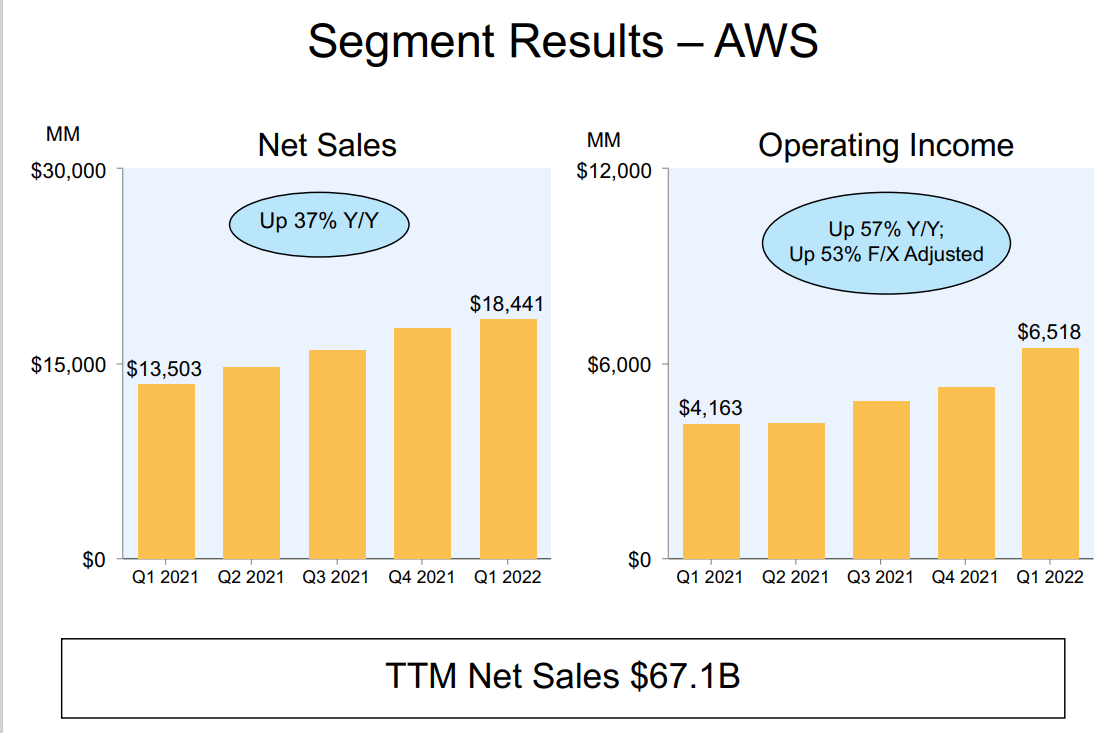
The highlight of the results was strength in AWS, which continues to benefit from the ongoing shift of enterprise workloads to the cloud.
While revenue was ahead of the guidance midpoint, first-party sales suffered its second straight quarter of year-over-year contraction, which we believe is a first but is not a surprise.
Operating margin was a concern, as inflation, excess labor, and excess capacity ate into profitability, which came in just above the low end of guidance and was well short of our expectations.
Meanwhile, second-quarter guidance is well short of our model, as we think profitability challenges will linger for a couple of quarters and perhaps into next year; Prime Day will move into the third quarter, and demand levels have not yet normalized post-COVID-19. While we expect the second half of the year to show improvements, we modestly lowered our growth and profitability estimates, particularly in the near term, to account for guidance and heightened uncertainty.” – Morningstar
Analysts also lowered their long-term growth outlook modestly.
- from 24% CAGR
- to 21.7% CAGR
What about the actual results?
- Q1 sales growth 8% (constant currency)
- online store: -3%
- 3rd party sellers: 7%
- physical stores: 17%
- subscription sales (Prime): 11%
- AWS: 37%
- Advertising: 23%
(Source: earnings presentation)
Amazon spent 23 years building up one of the greatest logistics capacities in history.
Then to keep up with pandemic demand it doubled its capacity in just two years.
- at a cost of $90.5 billion in capex
- plus $60.1 billion more expected in 2022
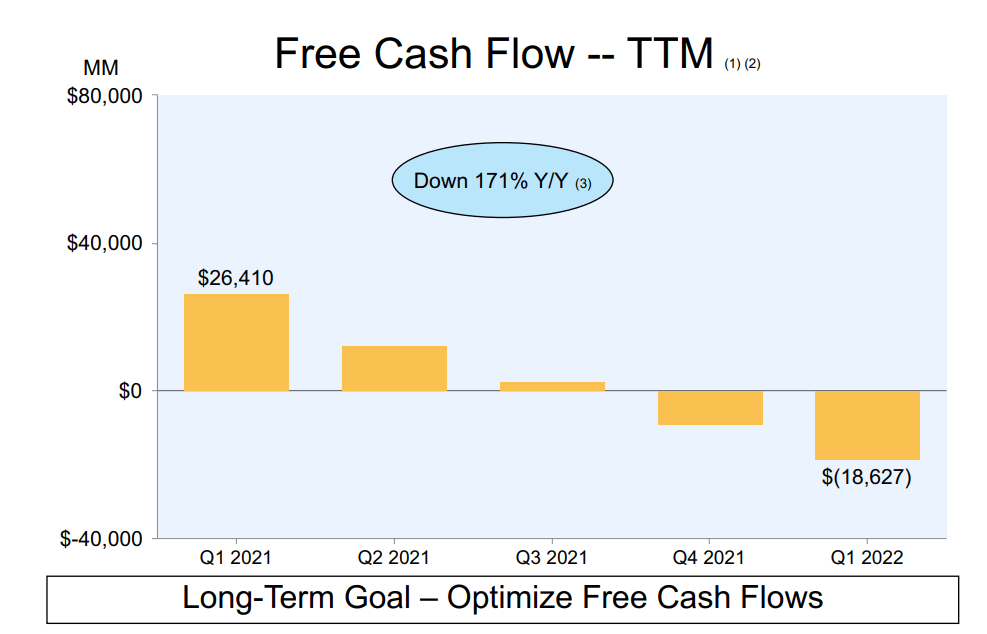
Free cash flows have turned deeply negative as they have many times in Amazon’s history during hyper-growth spending phases.
Some of the pull forward demand from the pandemic is now normalizing, creating temporarily excess capacity.
- Amazon had no choice but to spend on growth or else lose market share and customer loyalty during the pandemic.
During this period, we doubled the size of our operations and nearly doubled our workforce to 1.6 million employees. Labor and physical space are no longer the bottlenecks they were throughout much of 2020 and 2021. However, we continue to face a variety of cost pressures in our consumer business.” – CFO, Q1 conference call
Growth spending is key to driving Prime growth, which is a more valuable customer base that spends more.
Our prime members continue to be key drivers of growth. Prime members have meaningfully increased their spending since the start of the pandemic, and we continue to see consistently high member renewal rates. We also added millions more new Prime members during the quarter.” – CFO
The cost to ship in overseas containers more than doubled compared to pre-pandemic rates. And the cost of fuel is approximately 1.5 times higher than it was even a year ago. Combined with the year-over-year increases in wage inflation, these inflationary pressures have added approximately $2 billion of incremental costs when compared to last year. While we will continue to look for ways to mitigate these costs, we expect they will be around for some time.” – CFO
Rising fuel costs and wage pressure are likely to continue weighing on profitability in the short term, to the tune of approximately $8 billion per year.
As the variant subsided in the second half of the quarter and employees returned from leave, we quickly transitioned from being understaffed to being overstaffed, resulting in lower productivity. This lower productivity added approximately $2 billion in costs compared to last year. In the last few weeks of the quarter and into April, we’ve seen productivity improvements across the network, and we expect to reduce these cost headwinds in Q2.” – CFO
Delivering costs and labor costs total about $10 billion in higher overall costs but labor productivity is starting to improve again.
Now that demand patterns have stabilized, we see an opportunity to better match our capacity to demand. We have lowered our operations, and capital expenditures for 2022 and are evaluating other ways to increase our fixed cost leverage. We estimate that this overcapacity, coupled with the extraordinary leverage we saw in Q1 of last year, resulted in $2 billion of additional costs year-over-year in Q1.” – CFO
Temporary overcapacity is adding $8 billion in annual costs, though this is not wasted spending, because Amazon needed that capacity to keep growing at incredible rates in the future.
We do expect the effects of these fixed cost leverage to persist for the next several quarters as we grow into this capacity. When you combine the impacts of the externally driven costs and the internally controllable costs, you get approximately $6 billion in incremental costs for the quarter.” – CFO
Factoring in the cost mitigation protocols AMZN is putting in place, in total costs were up $6 billion for the quarter, or $24 billion per year.
Our guidance includes an expectation that we will incur approximately $4 billion of these incremental costs in Q2.” – CFO
By Q2 AMZN expects those extra costs to decline to $4 billion per quarter or $16 billion per year.
(Source: FactSet Research Terminal)
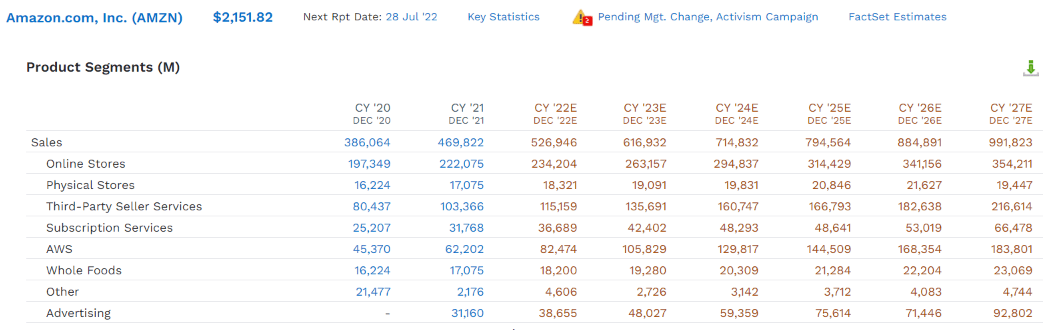
Amazon’s 2027 sales consensus fell from $1.02 trillion to $992 billion.
- so now Amazon is expected to become the first $1 trillion sales company in 2028 instead of 2027
It’s expected to deliver modest to incredible growth across all its operating units.
- 20% growth in AWS through 2027
- 20% growth in advertising
- 13% growth in subscriptions (Prime)
- 13% growth in 3rd party sales
- 8% growth in its own online stores
(Source: earnings presentation)
- AWS continues to grow like a weed
- operating margins up to 35%
- 57% growth in operating income at AWS
- margins are expanding despite AWS cutting prices (economies of scale)
Why not just spin off AWS and Advertising to “maximize shareholder value”?
- that’s hedge fund thinking, not long-term thinking
- retail feeds data into AWS and advertising
- AWS and advertising feed data into retail
- only by linking the data from every part of the empire, fed into AMZN’s machine learning algos can AMZN truly maximize long-term free cash flow and shareholder value
- break up the empire and the sum of the parts is worth significant less
Quantitative Analysis: The Math Backing Up The Investment Thesis
AMZN Credit Ratings
| Rating Agency | Credit Rating | 30-Year Default/Bankruptcy Risk | Chance of Losing 100% Of Your Investment 1 In |
| S&P | AA Stable | 0.51% | 196.1 |
| Fitch | AA- Stable | 0.55% | 181.8 |
| Moody’s | A1 (A+ equivalent) Stable | 0.60% | 166.7 |
| Consensus | AA- Stable | 0.55% | 180.7 |
(Source: S&P, Moody’s, Fitch)
Rating agencies estimate a 0.55% fundamental risk in buying Amazon today.
- 1 in 181 chance of losing all your money over the next 30 years
AMZN Leverage Consensus Forecast
| Year | Debt/EBITDA | Net Debt/EBITDA (3.0 Or Less Safe According To Credit Rating Agencies) | Interest Coverage (8+ Safe) |
| 2020 | 0.56 | -0.09 | 13.90 |
| 2021 | 0.68 | -0.28 | 13.75 |
| 2022 | 0.69 | -0.17 | 10.08 |
| 2023 | 0.53 | -0.35 | 16.85 |
| 2024 | 0.40 | -0.54 | 28.58 |
| 2025 | 0.31 | -0.71 | 39.64 |
| 2026 | 0.25 | -1.21 | 52.74 |
| 2027 | 0.21 | -1.42 | 66.80 |
| Annualized Change | -13.11% | 48.56% | 25.13% |
(Source: FactSet Research Terminal)
Amazon has more cash than debt already and its balance sheet is expected to get rapidly stronger over time.
AMZN Balance Sheet Consensus Forecast
| Year | Total Debt (Millions) | Cash | Net Debt (Millions) | Interest Cost (Millions) | EBITDA (Millions) | Operating Income (Millions) |
| 2020 | $31,816 | $42,122 | -$5,079 | $1,647 | $57,284 | $22,899 |
| 2021 | $48,744 | $36,220 | -$20,346 | $1,809 | $71,994 | $24,879 |
| 2022 | $51,314 | $67,329 | -$12,998 | $2,018 | $74,672 | $20,345 |
| 2023 | $51,124 | $100,528 | -$33,812 | $2,197 | $96,394 | $37,029 |
| 2024 | $48,945 | $144,188 | -$65,061 | $2,096 | $120,978 | $59,909 |
| 2025 | $47,108 | $270,216 | -$107,346 | $1,933 | $151,014 | $76,631 |
| 2026 | $47,108 | $404,329 | -$229,430 | $1,979 | $189,824 | $104,379 |
| 2027 | $46,691 | $502,633 | -$318,442 | $2,029 | $224,882 | $135,533 |
| Annualized Growth | 5.63% | 42.50% | 80.61% | 3.02% | 21.58% | 28.92% |
(Source: FactSet Research Terminal)
- cash position growing at 43% CAGR
- net cash growing at 81% CAGR
- cash flows growing at 22% to 29% CAGR
- by 2027 an estimated $318 billion in net cash
- $503 billion in total cash
- Apple began the largest capital return in history at $250 billion in cash
Bond Profile
- $77 billion in liquidity
- 98% unsecured bonds (maximum financial flexibility)
- well-staggered bond maturities, no trouble refinancing maturing debt
- 1.64% average borrowing cost vs bond market’s 2.55% long-term inflation forecast
- AMZN’s effective real interest rate is -0.8% vs 12.8% return on invested capital
AMZN Credit Default SWAP Spreads: Bond Market’s Real-Time Fundamental Risk Assessment

(Source: FactSet Research Terminal)
Credit default swaps are insurance against bond defaults, and thus represent a real-time bond market estimate of a company’s short and medium-term bankruptcy risk.
AMZN’s CDS is relatively stable over time.
- note how stable AMZN’s fundamental risk is compared to the stock price
- analysts, rating agencies, and the bond market all agree the thesis remains intact
- Bond investors are saying “buy with confidence”
AMZN GF Score: The Newest Addition To The DK Safety And Quality Model
The GF Score is a ranking system that has been found to be closely correlated to the long-term performances of stocks by backtesting from 2006 to 2021.” – Gurufocus
GF Score takes five key aspects into consideration. They are:
- Financial Strength
- Profitability
- Growth
- Valuation
- Momentum

(Source: Gurufocus Premium)
AMZN’s exceptionally strong 92/100 GF score confirms its excellent fundamentals as well as attractive valuation.
An industry leader in financial strength, profitability, growth, and valuation.
Profitability: Wall Street’s Favorite Quality Proxy
AMZN’s profitability is historically within the top 10% of chipmakers.
AMZN Trailing 12-Month Profitability Vs Peers
| Metric | Industry Percentile | Major Cyclical Retailers More Profitable Than AMZN (Out Of 1,122) |
| Gross Margins | 11.13 | 997 |
| Operating Margin | 48.02 | 583 |
| Net Margin | 61.55 | 431 |
| Return On Equity | 75.21 | 278 |
| Return On Assets | 66.58 | 375 |
| Returns On Invested Capital | 62.77 | 418 |
| Return On Capital | 52.56 | 532 |
| Return On Capital Employed | 58.96 | 460 |
| Average | 60.81 | 440 |
(Source: Gurufocus Premium)
Profitability has been hurt by that $6 billion in extra costs in Q1 but remains above average.
Over the last 20 years, AMZN’s industry-leading profitability has been stable or improving, confirming a wide and stable moat.
- the recent decline in profitability isn’t expected to last long
AMZN Margin Consensus Forecast
| Year | FCF Margin | EBITDA Margin | EBIT (Operating) Margin | Net Margin | Return On Capital Expansion | Return On Capital Forecast |
| 2020 | 8.0% | 14.8% | 5.9% | 5.5% | 2.58 | |
| 2021 | -1.9% | 15.3% | 5.3% | 7.1% | TTM ROC | 12.53% |
| 2022 | 2.6% | 14.2% | 3.9% | 2.1% | Latest ROC | NA |
| 2023 | 6.0% | 15.6% | 6.0% | 4.8% | 2027 ROC | 32.33% |
| 2024 | 8.2% | 16.9% | 8.4% | 6.5% | 2027 ROC | NA |
| 2025 | 9.3% | 19.0% | 9.6% | 7.9% | Average | 32.33% |
| 2026 | 15.4% | 21.5% | 11.8% | 10.3% | Industry Median | 11.69% |
| 2027 | 17.1% | 22.7% | 13.7% | 12.0% | AMZN/Industry Median | 2.77 |
| Annualized Growth | 11.41% | 6.24% | 12.66% | 11.70% | Vs S&P | 2.21 |
| Annualized Growth (Ignoring Pandemic) | NA | 6.75% | 17.12% | 9.12% |
(Source: FactSet Research Terminal)
Compared to 2020 AMZN’s free cash flow margins are expected to more than double by 2027.
Return on capital is pre-tax profit/operating capital (the money it takes to run the business).
- Joel Greenblatt’s gold standard proxy for quality and moatiness
Analysts are expecting ROC to nearly triple by 2027.
- and achieve almost 3X the industry norm
- and more than 2X the S&P 500
AMZN’s ROC Has Been Stable For A Decade
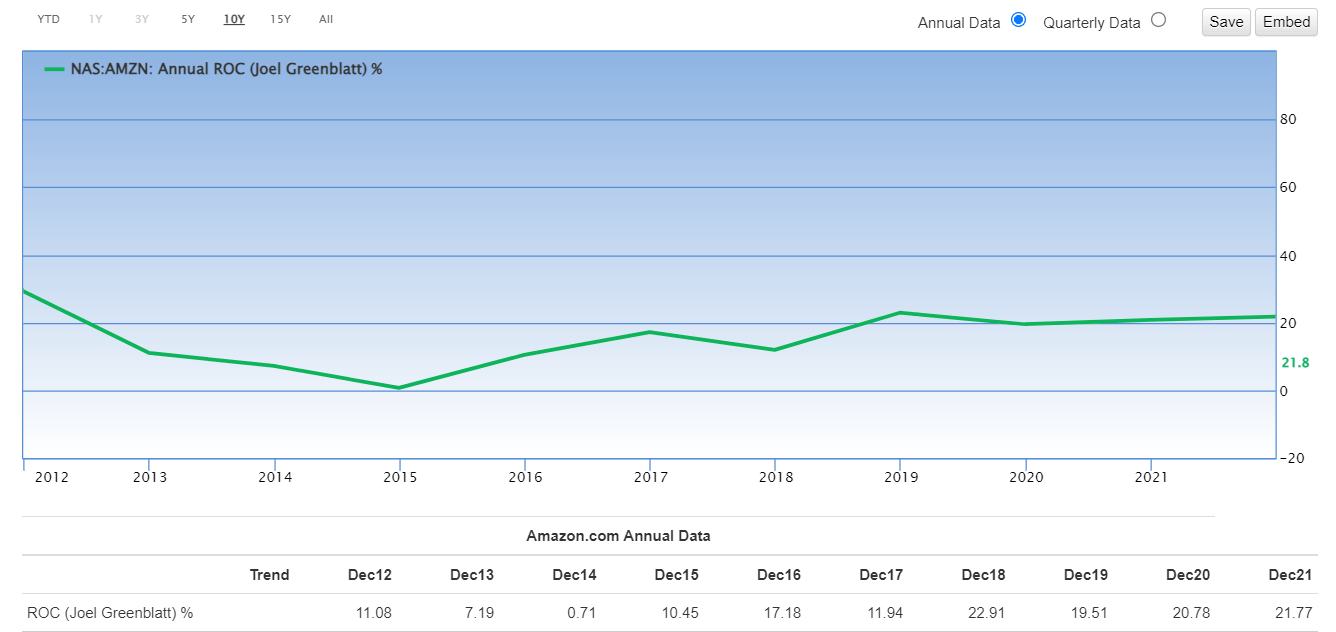
(Source: Gurufocus Premium)
AMZN’s ability to sustain industry-leading profitability over the decades despite all its challenges and risks confirms a wide and stable moat.
Reason Four: Amazing Growth Prospects As Far As The Eye Can See
Amazon’s profitability has been hurt in the short term by its recent successful efforts to double capacity within two years.
Amazon CEO Andy Jassy said the company is focused on returning to a “healthy level of profitability” after slowing retail sales and rising costs ate into its latest quarterly earnings. We have effectively lowered our cost structure before and I have high confidence that we’ll get back on track as we work through these incredibly unusual past two years,” Jassy said Wednesday at Amazon’s annual shareholder meeting, his first since taking the helm from founder Jeff Bezos in July.” – CNBC
But cost controls doesn’t mean Amazon is done investing in future growth.
Far from it.
AMZN Growth Spending Consensus Forecast
| Year | SG&A (Selling, General, Administrative) | R&D | Capex | Total Growth Spending | Sales | Growth Spending/Sales |
| 2021 | $41,374 | $49,407 | $55,396 | $146,177 | $469,822 | 31.11% |
| 2022 | $46,372 | $61,509 | $60,135 | $168,016 | $526,946 | 31.88% |
| 2023 | $52,714 | $7,117 | $62,118 | $121,949 | $616,932 | 19.77% |
| 2024 | $57,813 | $78,921 | $65,778 | $202,512 | $714,832 | 28.33% |
| 2025 | $63,506 | $78,372 | $69,493 | $211,371 | $794,564 | 26.60% |
| 2026 | $69,895 | $86,060 | $65,697 | $221,652 | $884,891 | 25.05% |
| 2027 | $75,749 | $95,014 | $69,052 | $239,815 | $991,823 | 24.18% |
| Annualized Growth | 10.61% | 11.51% | 3.74% | 8.60% | 13.26% | -4.12% |
| Total Spending 2022 To 2027 | $366,049 | $406,993 | $392,273 | $1,165,315 | $4,529,988 | NA |
(Source: FactSet Research Terminal)
AMZN is increasing its growth spending by 9% per year, from $146 billion in 2021 to almost a quarter of a trillion in 2027.
- almost $100 billion in R&D alone in 2027
- $4.5 trillion in cumulative sales over the next six years
- $1.2 trillion in cumulative growth spending in the next six years
For context, the US government is planning on spending $1.2 trillion on infrastructure in the next 10 years.
- Amazon is spending more on growth than the US government
AMZN Medium-Term Growth Consensus Forecast
| Year | Sales | Free Cash Flow | EBITDA | EBIT (Operating Income) | Net Income |
| 2020 | $386,064 | $31,018 | $57,284 | $22,899 | $21,331 |
| 2021 | $469,822 | -$9,069 | $71,994 | $24,879 | $33,364 |
| 2022 | $526,946 | $13,876 | $74,672 | $20,345 | $10,896 |
| 2023 | $616,932 | $36,748 | $96,394 | $37,029 | $29,466 |
| 2024 | $714,832 | $58,752 | $120,978 | $59,909 | $46,298 |
| 2025 | $794,564 | $73,814 | $151,014 | $76,631 | $62,937 |
| 2026 | $884,891 | $136,088 | $189,824 | $104,379 | $91,207 |
| 2027 | $991,823 | $169,771 | $224,882 | $135,533 | $118,922 |
| Annualized Growth | 14.43% | 27.49% | 21.58% | 28.92% | 27.82% |
| Annualized Growth (Ignoring Pandemic) | 13.26% | NA | 20.90% | 32.65% | 23.59% |
| Cumulative Over The Next 6 Years | $4,529,988 | $489,049 | $857,764 | $433,826 | $359,726 |
(Source: FactSet Research Terminal)
Amazon’s growth is astounding given its size.
- 13% sales growth outside of the pandemic on a base of nearly $500 billion in revenue
- free cash low growing almost 30% per year
- bottom line growing at 21% to 33% per year
Amazon is expected to generate $170 billion in free cash flow in 2027 alone.
And almost $500 billion in free cash flow over the next six years.
- there has never been a growth stock like Amazon
- this level of growth is unprecedented in human history
AMZN Dividend Growth/Buy Back Consensus Forecast
| Year | Dividend Consensus | FCF/Share Consensus | FCF Payout Ratio | Retained (Post-Dividend) Free Cash Flow | Buyback Potential | Debt Repayment Potential |
| 2022 | $0.00 | $15.11 | 0.0% | $7,691 | 0.70% | 15.8% |
| 2023 | $0.00 | $65.47 | 0.0% | $33,324 | 3.04% | 64.9% |
| 2024 | $0.00 | $131.66 | 0.0% | $67,015 | 6.12% | 130.6% |
| 2025 | $0.00 | $194.94 | 0.0% | $99,224 | 9.06% | 194.1% |
| 2026 | $0.00 | $252.28 | 0.0% | $128,411 | 11.73% | 262.4% |
| 2027 | $0.00 | $311.06 | 0.0% | $158,330 | 14.46% | 336.1% |
| Total 2022 Through 2024 | $0.00 | $970.52 | 0.0% | $493,994.68 | 45.13% | 962.69% |
| Annualized Rate | NA | 83.11% | NA | 83.11% | 83.11% | 84.37% |
(Source: FactSet Research Terminal)
Amazon isn’t expected to pay a dividend for the foreseeable future.
However, $494 billion in cumulative retained free cash flow has to go somewhere.
- enough to pay back its debt more than 10X over
- $10 billion buyback authorization is a drop in the bucket of what’s needed
- AMZN could repurchase nearly half its shares at current valuations
- $2.7 billion is the buyback consensus for 2022
- likely to be overly conservative given AMZN’s incredible discount to fair value
AMZN Long-Term Growth Outlook
- 20-year growth rate: 32% CAGR
- consensus growth range (5 sources): 19.1% to 40.5% CAGR
- individual analyst growth range: 4.9% to 36.0% CAGR
- median growth consensus from all analysts: 21.7% CAGR
How accurate are analysts at forecasting AMZN’s growth over time?

FAST Graphs, FactSet
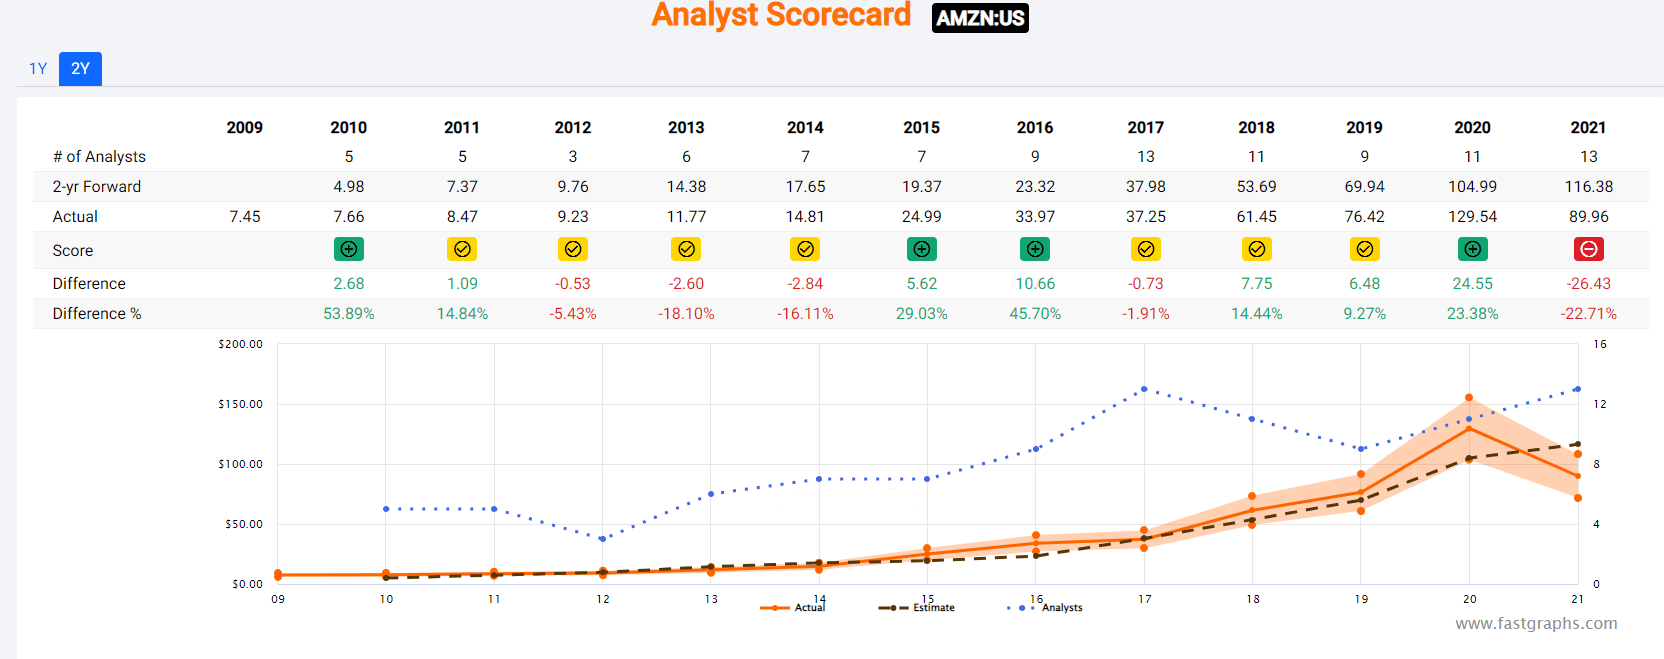
FAST Graphs, FactSet
Smoothing for outliers analyst margins of error are 20% to the downside and 30% to the upside.
- 15% to 41% CAGR adjusted growth consensus range
- 70% statistical probability AMZN grows at 15% to 41% over time
Analysts expect AMZN’s growth to be similar to the last 12 years. And the company’s numerous growth catalysts make that forecast reasonable.
Reason Five: The Best Valuation In 7 Years
For 20 years, outside of bear markets and bubbles, billions of investors have paid 25X to 27X cash flow for Amazon.
- a 91% statistical probability that about 26X cash flow is intrinsic value for AMZN
| Metric | Historical Fair Value Multiples (14 Years) | 2022 | 2023 | 2024 | 2025 | 12-Month Forward Fair Value |
| Operating Cash Flow | 25.98 | $3,371.68 | $4,800.06 | $6,943.93 | $8,089.39 | |
| Average | $3,371.68 | $4,800.06 | $6,943.93 | $8,089.39 | $3,921.06 | |
| Current Price | $2,151.82 | |||||
| Discount To Fair Value | 36.18% | 55.17% | 69.01% | 73.40% | 45.12% | |
| Upside To Fair Value | 56.69% | 123.07% | 222.70% | 275.93% | 82.22% | |
| 2022 OCF | 2023 OCF | 2023 Weighted OCF | 12-Month Forward OCF | 12-Month Average Fair Value Forward P/OCF | Current Forward P/OCF | |
| $129.78 | $184.76 | $71.06 | $150.93 | 26.0 | 14.3 |
AMZN at 14.3X forward cash flow is a 45% screaming bargain.
- 15.6X cash-adjusted earnings
- not just growth at a reasonable price, but hyper-growth at a highly attractive price
| Analyst Median 12-Month Price Target | Morningstar Fair Value Estimate |
| $3,648.18 (24.2X cash flow) | $3,850.00 (25.5X cash flow) |
| Discount To Price Target (Not A Fair Value Estimate) | Discount To Fair Value |
| 41.02% | 44.11% |
| Upside To Price Target | Upside To Fair Value |
| 69.54% | 78.92% |
Morningstar’s discounted cash flow model works out to 25.5X cash flow, in-line with ours and historical fair value.
Analysts expect AMZN to trade at 24.2X cash flow in 1 year, delivering 70% returns in the next 12 months.
I don’t care about 12-month return forecasts, but whether the margin of safety is enough to compensate for AMZN’s risk profile.
| Rating | Margin Of Safety For Medium-Risk 13/13 Ultra SWAN quality companies | 2022 Price | 2023 Price | 12-Month Forward Fair Value |
| Potentially Reasonable Buy | 0% | $3,371.68 | $4,800.06 | $3,921.06 |
| Potentially Good Buy | 5% | $3,203.10 | $4,560.06 | $3,725.01 |
| Potentially Strong Buy | 15% | $2,865.93 | $4,080.06 | $3,332.90 |
| Potentially Very Strong Buy | 25% | $2,402.33 | $3,600.05 | $2,940.80 |
| Potentially Ultra-Value Buy | 35% | $2,191.59 | $3,120.04 | $2,548.69 |
| Currently | $2,151.82 | 36.18% | 55.17% | 45.12% |
| Upside To Fair Value (Not Including Dividends) | 56.69% | 123.07% | 82.22% |
For anyone comfortable with its risk profile, AMZN is a potentially Ultra Value strong buy.
Risk Profile: Why Amazon Isn’t Right For Everyone
There are no risk-free companies and no company is right for everyone. You have to be comfortable with the fundamental risk profile.
What Could Cause AMZN’s Investment Thesis To Break
- safety falls to 40% or less
- balance sheet collapses (highly unlikely, 0.55% probability according to S&P)
- Government breakup
- AWS market share collapses
- Advertising business is destroyed by regulations that ban the usage of user data
- growth outlook falls to less than 10% for seven years
- AMZN’s role in my portfolio is to deliver long-term 10+% returns with minimal fundamental risk
How long it takes for a company’s investment thesis to break depends on the quality of the company.
| Quality | Years For The Thesis To Break Entirely |
| Below-Average | 1 |
| Average | 2 |
| Above-Average | 3 |
| Blue-Chip | 4 |
| SWAN | 5 |
| Super SWAN | 6 |
| Ultra SWAN | 7 |
| 100% Quality Companies (MSFT, LOW, and MA) | 8 |
These are my personal rule of thumb for when to sell a stock if the investment thesis has broken.
AMZN is highly unlikely to suffer such catastrophic declines in fundamentals.
AMZN’s Risk Profile Includes
- inherent cyclicality of retail with the economy
- disruption risk (nearly 1,000 major competitors globally) including MSFT FB, and GOOG in its most important businesses
- political/regulatory risk – anti-trust risk domestically and globally
- global expansion risk (not as easy to disrupt foreign markets with entrenched giants)
- new market penetration risk: healthcare especially is a very highly regulated and challenging industry to disrupt
- M&A execution risk
- labor retention risk (tightest job market in over 50 years and finance is a high paying industry)
- Labor relations risk: the introduction of unions could increase labor expenses by approximately $150 million per 1% of the workforce (up to $15 billion per year)
- cybersecurity risk: hackers and ransomware
- currency risk: almost 40% of sales are from outside the US
Amazon Watch: Putting a number to the unionization push
By itself, the New York unionization is estimated to represent a ~$200M or less hit to AMZN’s Opex tally or a ~0.4% reduction to 2023 EBIT. While a rapid trend towards unionization is not anticipated, if applied to AMZN’s broader 750,000 U.S. fulfillment/transportation workforce, every 1% of employees that unionize is estimated to add an incremental ~$150M to annual Opex.” – Seeking Alpha
This single fulfillment center won’t have a meaningful impact on AMZN’s costs but if it were to represent a new trend then AMZN’s margin expansion forecasts could come down a bit.
How do we quantify, monitor, and track such a complex risk profile? By doing what big institutions do.
Long-Term Risk Analysis: How Large Institutions Measure Total Risk
- see the risk section of this video to get an in-depth view (and link to two reports) of how DK and big institutions measure long-term risk management by companies
AMZN Long-Term Risk Management Consensus
| Rating Agency | Industry Percentile | Rating Agency Classification |
| MSCI 37 Metric Model | 48.0% | BBB, Average, Positive Trend |
| Morningstar/Sustainalytics 20 Metric Model | 1.8% | 30.2/100 high-Risk |
| Reuters’/Refinitiv 500+ Metric Model | 100.0% | Excellent, #1 Industry Leader |
| S&P 1,000+ Metric Model | 25.0% | Poor, Stable Trend |
| Just Capital 19 Metric Model | 84.9% | Very Good |
| FactSet | 30.0% | Industry Leader, Positive Trend |
| Morningstar Global Percentile (All 15,000 Rated Companies) | 37.2% | Below-Average, Stable Trend |
| Just Capital Global Percentile (All 954 Rated US Companies) | 89.0% | Very Good, bordering on exceptional |
| Consensus | 52% | Medium-Risk, Average Risk-Management, Stable Trend |
(Sources: MSCI, Morningstar, S&P, FactSet)
AMZN’s Long-Term Risk Management Is The 349th Best In The Master List (30th Percentile)
| Classification | Average Consensus LT Risk-Management Industry Percentile | Risk-Management Rating |
| S&P Global (SPGI) #1 Risk Management In The Master List | 94 | Exceptional |
| Strong ESG Stocks | 78 | Good – Bordering On Very Good |
| Foreign Dividend Stocks | 75 | Good |
| Ultra SWANs | 71 | Good |
| Low Volatility Stocks | 68 | Above-Average |
| Dividend Aristocrats | 67 | Above-Average |
| Dividend Kings | 63 | Above-Average |
| Master List average | 62 | Above-Average |
| Hyper-Growth stocks | 61 | Above-Average |
| Monthly Dividend Stocks | 60 | Above-Average |
| Dividend Champions | 57 | Average |
| Amazon | 52 | Average |
(Source: DK Research Terminal)
AMZN’s risk-management consensus is in the bottom 30% of the world’s highest quality companies and similar to that of such other blue-chips as
- Donaldson Company (DCI) – dividend champion
- McDonald’s (MCD) – dividend aristocrat
- Cullen/Frost Bankers (CFR) – dividend champion
- Nordson (NDSN) – dividend king
- SEI Investments (SEIC) – dividend champion
- UGI Corp (UGI) – dividend champion
- Broadcom (AVGO)
The bottom line is that all companies have risks, and AMZN is average at managing theirs.
How We Monitor AMZN’s Risk Profile
- 53 analysts
- 3 credit rating agencies
- 8 total risk rating agencies
- 61 experts who collectively know this business better than anyone other than management
- and the bond market for real-time fundamental risk assessments
When the facts change, I change my mind. What do you do sir?” – John Maynard Keynes
There are no sacred cows at iREIT or Dividend Kings. Wherever the fundamentals lead we always follow. That’s the essence of disciplined financial science, the math behind retiring rich and staying rich in retirement.
Bottom Line: It’s The Best Time In 7 Years To Buy Amazon
I’m not a market timer, and I can’t tell you when this bear market will end.
| Time Frame | Historically Average Bear Market Bottom |
| Non-Recessionary Bear Markets Since 1965 | -21% (Achieved May 20th, 2020) |
| Median Recessionary Bear Market Since WWII | -24% |
| Non-Recessionary Bear Markets Since 1928 | -26% |
| Bear Markets Since WWII | -30% |
| Recessionary Bear Markets Since 1965 | -36% |
| All 140 Bear Markets Since 1792 | -37% |
| Average Recessionary Bear Market Since 1928 | -40% |
| (Sources: Ben Carlson, Bank of America, Oxford Economics, Goldman Sachs) |
That will depend on what happens with the economy and interest rates, over the next two years.
There are a lot of short-term risks to the economy in the short-term, the biggest one is persistently high inflation.
For example, JPMorgan recently forecast that US gasoline prices could hit $6.20 in August.
And that doesn’t factor in the possibility of oil prices rising to $150 according to Bank of America if China ends its COVID-zero policy and reopens its economy.
Combined with high housing inflation and food inflation, as well as an insatiable demand for travel this summer, it’s possible that inflation doesn’t come down as fast as economists expect.
- the consensus is that inflation falls by 0.2% per month through the end of the year, to 6.9% by December.
- and then falls 0.33% per month next year down to 2.8% by the end of 2023
Deutsche Bank’s base case forecast is that high inflation forces the Fed to raise interest rates to 5% to 6% by mid-2023.
- continuous 0.5% hikes at every meeting
Bridgewater, the world’s largest hedge fund, thinks that to beat inflation the Fed would have to raise rates to 5.5%.
- triggering a severe recession
- and a 40% S&P 500 crash
Deutsche Bank also thinks a severe recession could be coming in late 2023 (ending in mid-2024).
- and they also think it would result in a 40% peak decline in the S&P 500
Morgan Stanley’s base case forecast is that we avoid a recession but its blue-chip economist team thinks the S&P bottoms this summer at 3,400, a 29% peak decline.
- they think the S&P trades relatively flat at 3,900 a year from now
In a worst-case scenario, Morgan Stanley thinks stocks could bottom at -40%, at which point credit markets would be at risk of freezing up and forcing the Fed to pivot to avoid another financial crisis and Great Depression.
What’s my point? A lot could still go wrong with the economy and the stock market.
BUT predictions of mega crashes of 60% or more are largely overblown.
For example, even Michael Burry, whose proprietary model says the S&P 500 MIGHT fall 61% over two to three years, is BUYING tech stocks TODAY.
- GOOG and FB most aggressively
Jeremy Grantham’s GMO also thinks that stocks COULD fall as much as 60% over three years.
- but GMO is investing client money into energy stocks TODAY
- and Grantham is recommending investors buy quality oil stocks and deep value TODAY
Even Robert Kiyosaki, the most alarmist permabear of all (a 90+% crash is coming soon according to him) is recommending buying things TODAY.
- Gold
- Food
- Guns
- Bitcoin (a most interesting recommendation given that crypto is highly correlated to stocks and he thinks stocks are going to crash 90%).
None of us know what the future holds but to be a long-term investor requires optimism that a brighter future is coming at some point.
A 42% crash in Amazon stock has a lot of investors scared, even terrified.
But after careful analysis of AMZN’s fundamentals, past, present, and consensus future, management, analysts, rating agencies, and the bond market are clear on one thing.
Amazon’s investment thesis remains firmly intact.
And shares are about 45% undervalued, the best valuation in seven years.
I am NOT saying to go “all in” on Amazon because it is absolutely at the bottom.
I am saying that if you don’t buy SOME Amazon at the best valuation in seven years you shouldn’t consider buying this company ever.
- no company is right for everyone
- and only those comfortable with its risk profile should ever own this company
I’ve been buying Amazon steadily in this bear market.
And as long as its fundamentals remain intact, I will continue doing so.
Not just because it has the potential to 6X in the next five years.
Not just because it’s expected to soon become the largest company in history by sales.
Not just because AWS today is worth more than the entire market cap of the company (you’re getting advertising and all other parts of the business for free).
I’m not buying Amazon because analysts think it could deliver 70% returns in a year (82% justified by fundamentals).
I’m not buying it to try to earn 12X the market’s expected returns through 2027.
I’m buying Amazon to own it for decades because it literally offers Buffett-like return potential for the next decade or more.
Amazon is not just the greatest growth story of our age, it remains a potential rich retirement dream stock.
And at these valuations? No matter where it ultimately bottoms, I can say one thing with 80% absolute certainty.
Anyone buying Amazon today is likely to feel like a stock market genus in 5+ years.