Mr. Olufunwa Akinmade, Divisional Head, Retail, SME Banking, and E-Business, Unity Bank Plc, explained that the “raison d’être for launching the Bank’s latest retail product called Yanga is to create a unique product proposition aimed at empowering Nigeria’s underbanked women entrepreneurs.”
Akinmade stated during a media interview, citing a recent EFInA report, that “there are 51 million Nigerian women above the age of 18, with over 41 percent of the unbanked.” According to these figures, there are 14-18 million female entrepreneurs – primarily in the micro SME category.”
Remember that Unity Bank launched the women-focused Yanga account in November 2021 to promote financial inclusion and serve unbanked women entrepreneurs in the MSME space across Nigeria.
As a result, the new retail product is intended to have a greater positive impact on Micro, Small, and Medium Enterprises (MSMEs) run by women in the mass-market retail space.
“Recent research has shown that Nigeria has the highest number of female entrepreneurs in the world, with an estimated 40 million SMEs, of which women constitute approximately 42 percent,” Akinmade says.
“These women have demonstrated beyond reasonable doubt their ability to generate wealth and contribute productively to the economy.” However, much more needs to be done, beginning with providing them with the necessary tools to realize their entrepreneurial potential.
“Right now, they face numerous institutional and cultural barriers when starting or running their businesses.” According to a recent report, only 22% of female entrepreneurs have access to finance, compared to 34% of male entrepreneurs.
“This is one of the reasons we introduced Yanga, to bridge this gap while also narrowing the population of underbanked female entrepreneurs.”
Akinmade went on to say that the Unity Yanga product will play a critical role in increasing financial inclusion and decreasing the number of underbanked women because it comes with a unique product proposition that includes an easy to operate and free to open Savings account with no identification required, a customized debit card, and dedicated sales officers.
Other distinctive features identified by him include special banking agents in each market location and quarterly Seminars at major market locations anchored by Unity Bank and its alliance partners.
“By rolling out this scheme across all geopolitical regions, Unity Bank’s goal is to work tirelessly towards reducing the country’s huge number of underbanked women,” he added.
(1) micro-loans and (2) HMO-offerings are important components of the Yanga Product experience.
The micro-loan would be made available through time-tested Credit Policies and technology-based credit scoring. These would aid in the detection of frivolous applications as well as the reduction of NPLs.
Yanga is available to all female entrepreneurs across the country. With its brand ambassador, popular Nollywood actor Sola Sobowale, the bank is currently conducting market activations in strategic locations across the country. The Yanga activation train has already visited Gombe, Akwa Ibom, and Ibadan, and it is currently in Lagos en route to Port Harcourt.
Investors will come back from the Memorial Day break with a focus on Europe, where leaders will be meeting in Brussels.
While the EU is not expected to approve a full ban on Russian oil, an embargo of seaborne deliveries or the general nature of the discussion could impact the energy market. OPEC is also on tap to meet next week, although no major fireworks are anticipated with the production statement.
Key economic reports due to watch include updates on construction spending, factory orders, U.S. auto sales and the May jobs report. Economists forecast 329K jobs addition for the month to fall back from the 428K job adds in April. The unemployment rate is seen drifting to 3.5% from 3.6%.
The IPO calendar is quiet again, but a riveting SPAC could come to the market in the retail sector, with Walmart (NYSE:WMT)-backed Symbotic likely to catch some attention amid the supply chain and labor disruption in the retail sector. On the corporate calendar, the earnings confessional will see visits from HP Inc. (HPQ), GameStop (GME), and Lululemon, while annual meetings at Alphabet (GOOG) and Walmart (WMT) will be full of shareholder activism.
Finally, next week will be the last chance for investors to buy Amazon (NASDAQ:AMZN) before the 20-for-1 stock split becomes effective on June 6.
It’s been a horrific start to the year for stocks in general, but especially tech stocks.
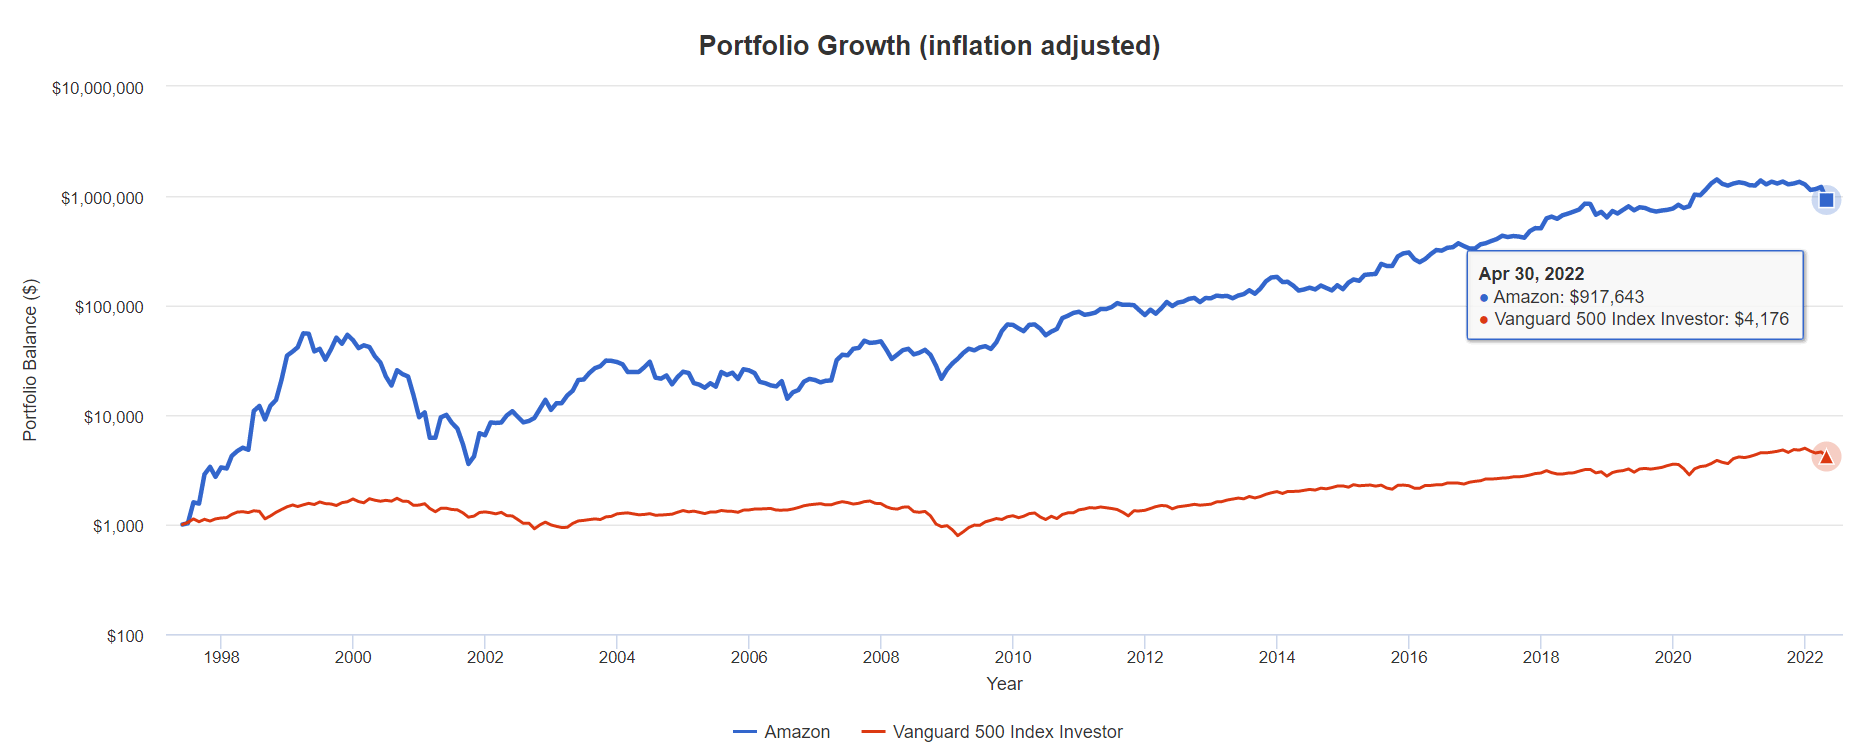
According to Bloomberg 2/3 of the S&P 500 is in a bear market, and half of the Nasdaq is down 50% or more.
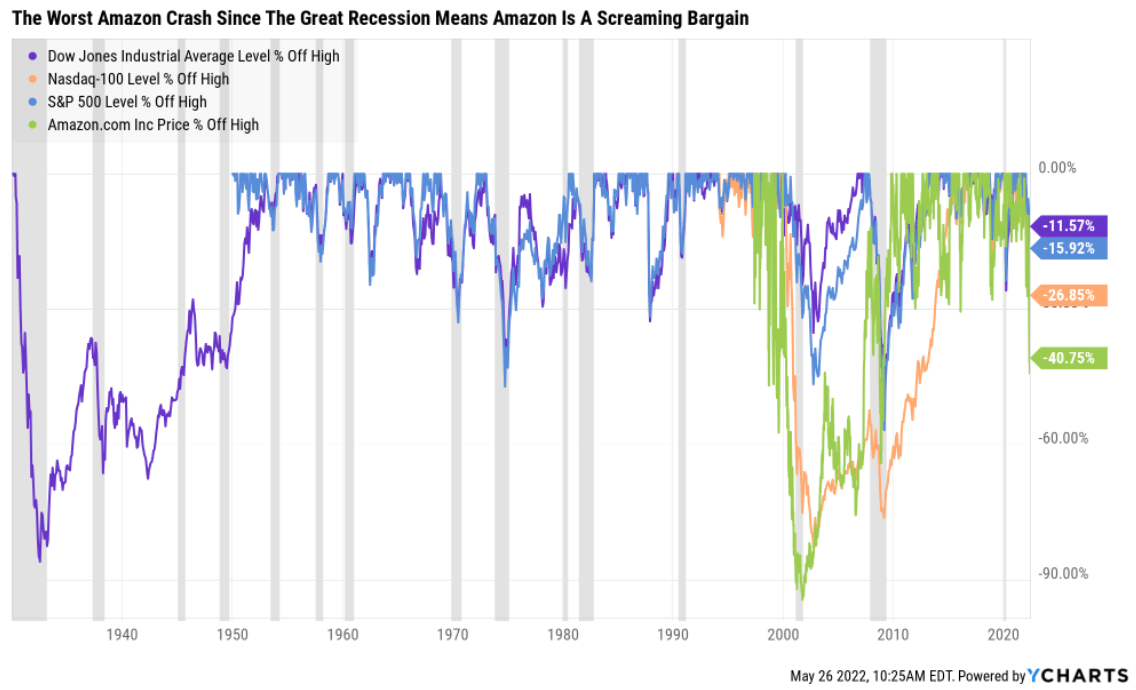
Ycharts
Amazon (NASDAQ:AMZN), a quintessential hyper-growth Ultra SWAN is down 41% of its highs, the worst crash since the Great Recession.
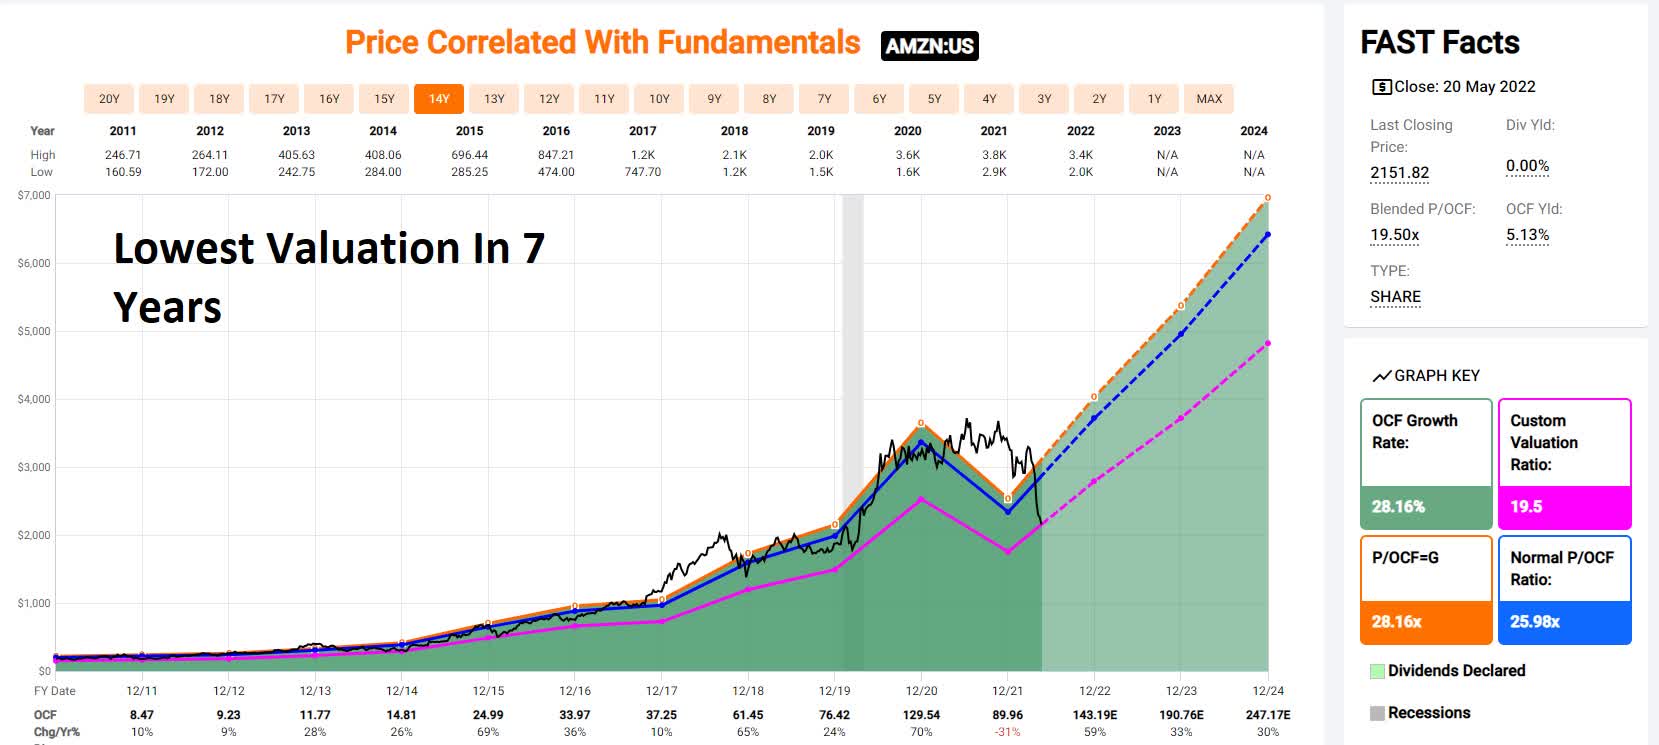
the lowest valuation in seven years
Naturally, Amazon shareholders want to know when the bottom will finally arrive and when it’s time to back up the truck on this legendary growth stock.
While I can’t tell you with confidence when Amazon will finally stop crashing, I can tell you with 80% confidence, that there are five reasons now is almost certainly the time to start buying Amazon more aggressively.
So let’s take a look at the five reasons the market is dead wrong to be so bearish on Amazon and why now might be the time to back up the truck on one of the greatest growth stories in history.
Reason One: Technical Analysis Has Good News For Amazon Bulls
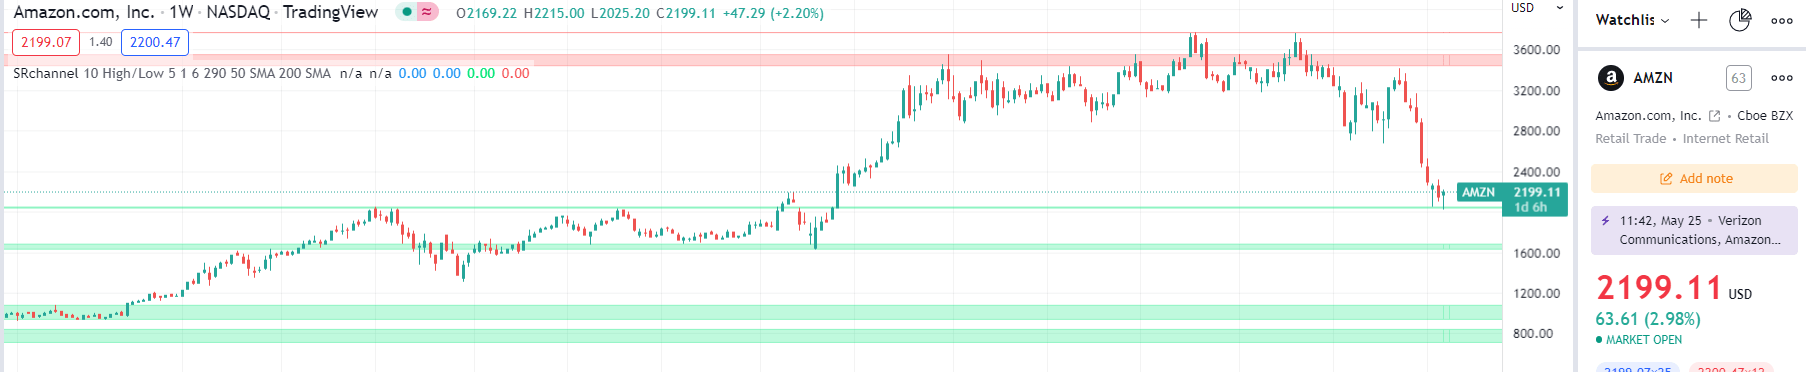
I’m not a technical focused analyst but Amazon did recently bounce off medium strength support, potentially indicating a short-term bottom.
Tradingview.com
Whether or not it continues to lower lows will depend on the broader market and economic conditions, but Amazon’s crash could be nearing its end.
StockTA.com
Recent short-term TA indicators are also becoming bullish, further giving support to the thesis that the worst MIGHT be behind Amazon’s share price.
But of course, I don’t recommend any blue-chip to try to score a quick gain, but to help you retire in safety and splendor.
And that is something Amazon can most assuredly do.
Reason Two: Amazon Is The Whole Package
Here’s the bottom line upfront on Amazon.
Reasons To Potentially Buy AMZN Today
97% quality medium-risk 13/13 Ultra SWAN hyper-growth company
100% balance safety score
45% undervalued (potential ultra value strong buy)
Fair Value: $3,921.06 (26.0X operating cash flow)
14.3X forward cash flow vs 25X to 27X historical
15.6X cash-adjusted earnings
AA stable outlook credit rating =0.51% 30-year bankruptcy risk
52nd industry percentile risk management consensus = average
19.1% to 40.5% CAGR margin-of-error growth consensus range
4.9% to 36% CAGR individual analyst growth range
21.7% CAGR median growth consensus
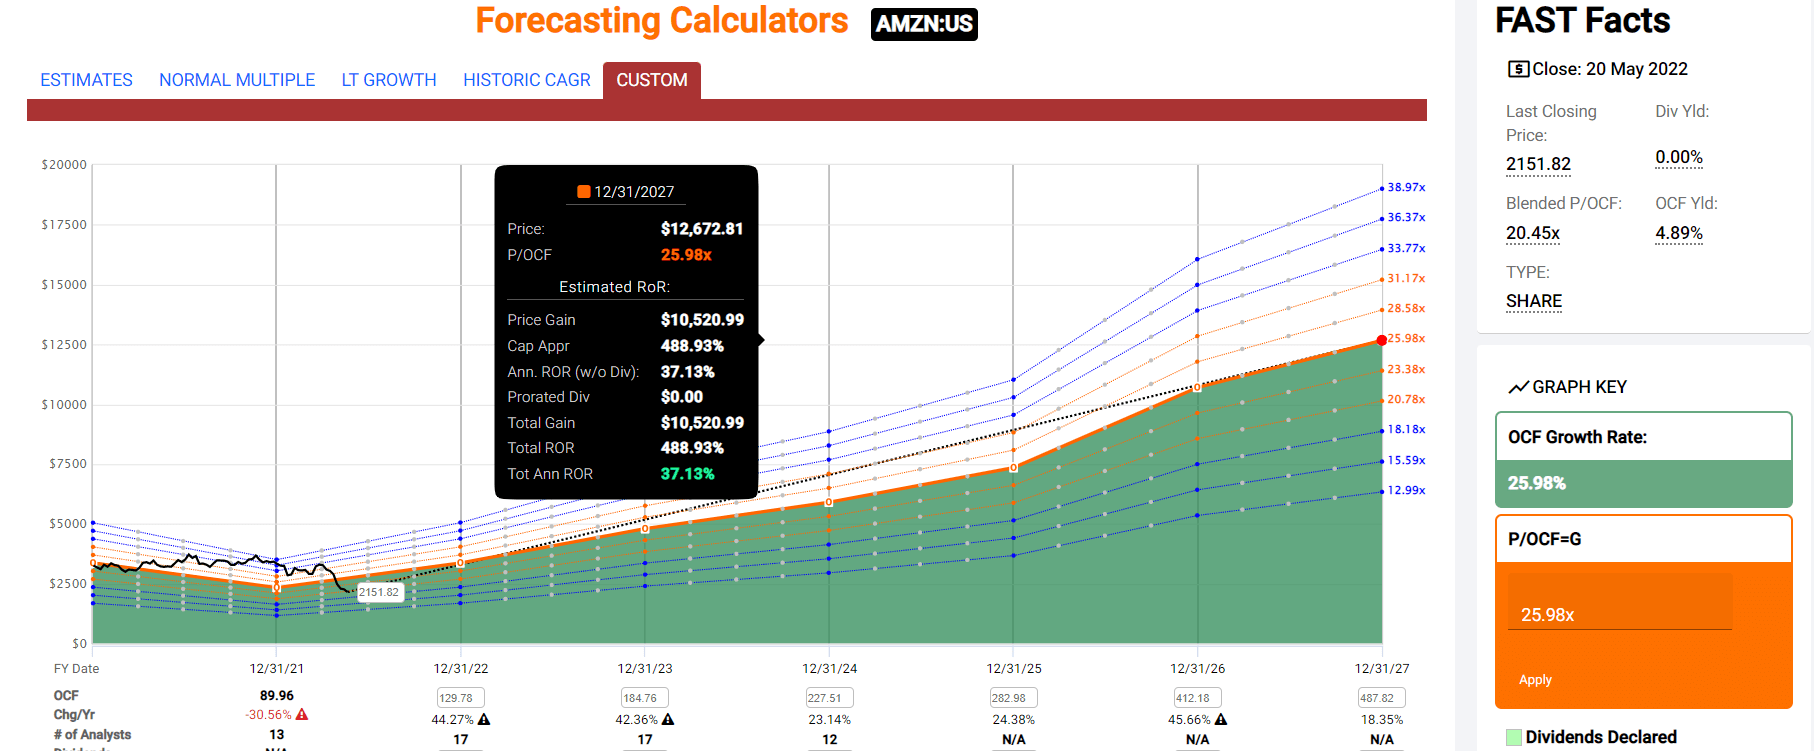
5-year consensus total return potential: 34% to 39% CAGR
Long-term total returns (a Ben Graham sign of quality)
Analyst consensus long-term return potential
In fact, it includes over 1,000 fundamental metrics including the 12 rating agencies we use to assess fundamental risk.
credit and risk management ratings make up 41% of the DK safety and quality model
dividend/balance sheet/risk ratings make up 82% of the DK safety and quality model
How do we know that our safety and quality model works well?
During the two worst recessions in 75 years, our safety model 87% of blue-chip dividend cuts, the ultimate baptism by fire for any dividend safety model.
How does AMZN score on our comprehensive safety and quality models?
AMZN Balance Sheet Safety
Rating
Dividend Kings Safety Score (162 Point Safety Model)
Approximate Dividend Cut Risk (Average Recession)
Approximate Dividend Cut Risk In Pandemic Level Recession
1 – unsafe
0% to 20%
over 4%
16+%
2- below average
21% to 40%
over 2%
8% to 16%
3 – average
41% to 60%
2%
4% to 8%
4 – safe
61% to 80%
1%
2% to 4%
5- very safe
81% to 100%
0.5%
1% to 2%
AMZN
100%
NA
NA
Risk Rating
Medium-Risk (52nd industry percentile risk-management consensus)
AA Stable outlook credit rating 0.55% 30-year bankruptcy risk
Section 2 of this video showcases the detailed investment thesis for AMZN.
including why AWS is likely worth more than Amazon’s market cap today
so is advertising
buy AMZN for AWS and get advertising and the rest of the business for free
Earnings Update
Pre-Earnings
Now
Change
2022 OCF
2023 OCF
2022 OCF
2023 OCF
2022 OCF
2023 OCF
$169.48
$206.27
$129.78
$184.76
-23.42%
-10.43%
Amazon’s earnings were disappointing and resulted in significant declines in 2022 and 2023 cash flow estimates.
Amazon’s Profitability Hit by Inflation, Excess Capacity; Guidance Doesn’t Help; FVE Down to $3,850″ – Morningstar
Amazon more than doubled its delivery capacity during the pandemic to take advantage of the greatest demand boom in history.
It now has excess capacity and rising input costs (like Target and Walmart) that are hurting margins temporarily.
The highlight of the results was strength in AWS, which continues to benefit from the ongoing shift of enterprise workloads to the cloud.
While revenue was ahead of the guidance midpoint, first-party sales suffered its second straight quarter of year-over-year contraction, which we believe is a first but is not a surprise.
Operating margin was a concern, as inflation, excess labor, and excess capacity ate into profitability, which came in just above the low end of guidance and was well short of our expectations.
Meanwhile, second-quarter guidance is well short of our model, as we think profitability challenges will linger for a couple of quarters and perhaps into next year; Prime Day will move into the third quarter, and demand levels have not yet normalized post-COVID-19. While we expect the second half of the year to show improvements, we modestly lowered our growth and profitability estimates, particularly in the near term, to account for guidance and heightened uncertainty.” – Morningstar
Analysts also lowered their long-term growth outlook modestly.
from 24% CAGR
to 21.7% CAGR
What about the actual results?
Q1 sales growth 8% (constant currency)
online store: -3%
3rd party sellers: 7%
physical stores: 17%
subscription sales (Prime): 11%
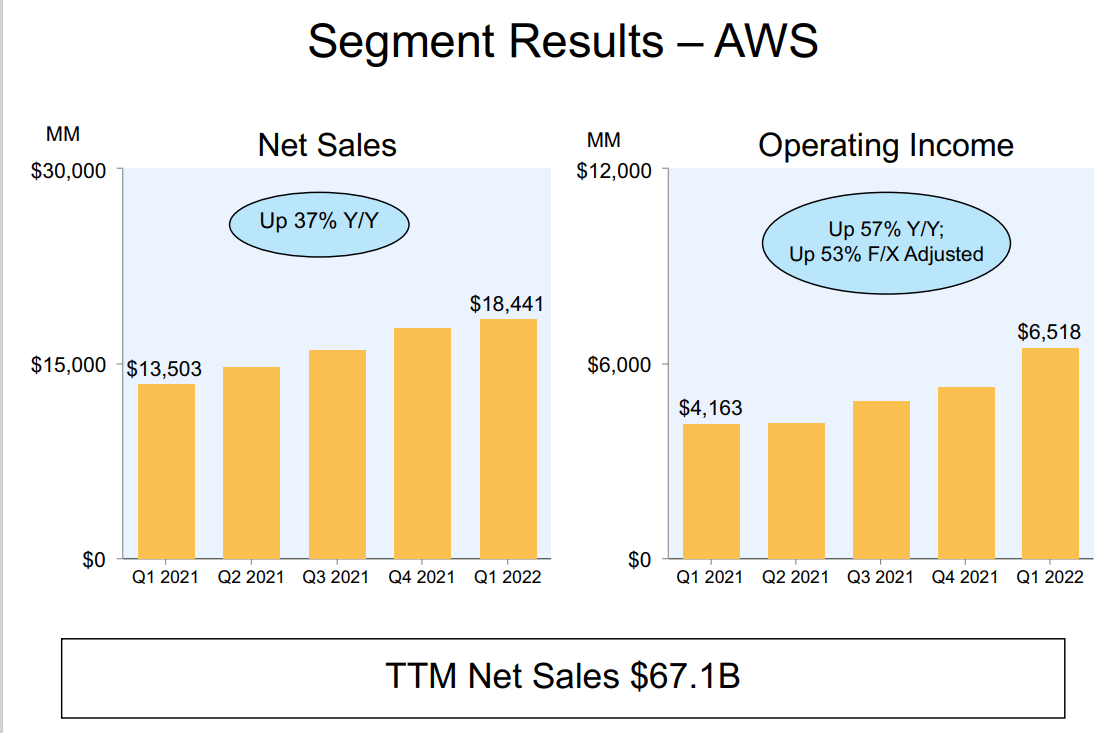
AWS: 37%
Advertising: 23%
(Source: earnings presentation)
Amazon spent 23 years building up one of the greatest logistics capacities in history.
Then to keep up with pandemic demand it doubled its capacity in just two years.
at a cost of $90.5 billion in capex
plus $60.1 billion more expected in 2022
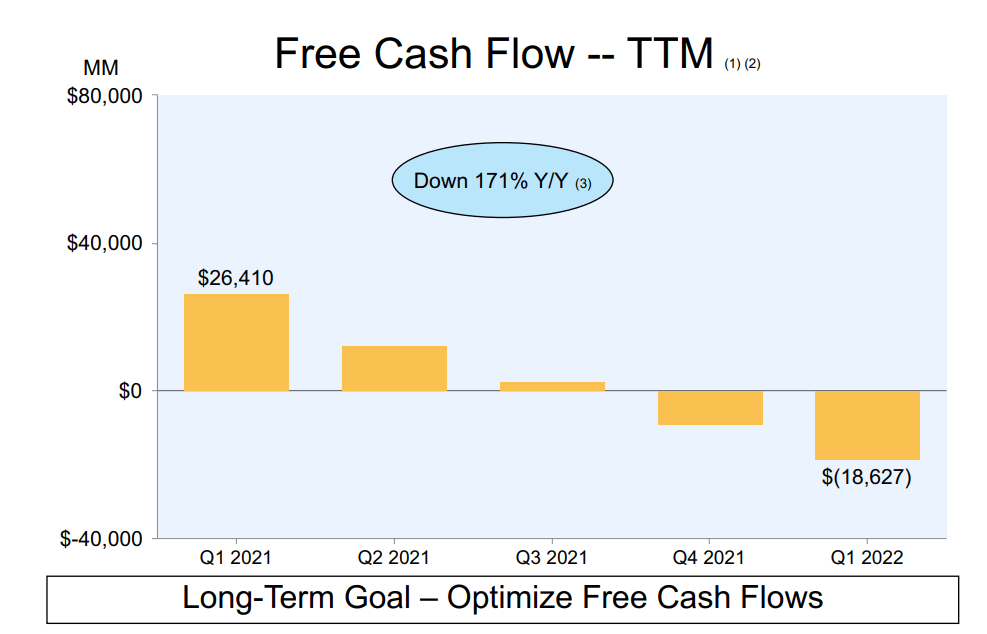
Free cash flows have turned deeply negative as they have many times in Amazon’s history during hyper-growth spending phases.
Some of the pull forward demand from the pandemic is now normalizing, creating temporarily excess capacity.
Amazon had no choice but to spend on growth or else lose market share and customer loyalty during the pandemic.
During this period, we doubled the size of our operations and nearly doubled our workforce to 1.6 million employees. Labor and physical space are no longer the bottlenecks they were throughout much of 2020 and 2021. However, we continue to face a variety of cost pressures in our consumer business.” – CFO, Q1 conference call
Growth spending is key to driving Prime growth, which is a more valuable customer base that spends more.
Our prime members continue to be key drivers of growth. Prime members have meaningfully increased their spending since the start of the pandemic, and we continue to see consistently high member renewal rates. We also added millions more new Prime members during the quarter.” – CFO
The cost to ship in overseas containers more than doubled compared to pre-pandemic rates. And the cost of fuel is approximately 1.5 times higher than it was even a year ago. Combined with the year-over-year increases in wage inflation, these inflationary pressures have added approximately $2 billion of incremental costs when compared to last year. While we will continue to look for ways to mitigate these costs, we expect they will be around for some time.” – CFO
Rising fuel costs and wage pressure are likely to continue weighing on profitability in the short term, to the tune of approximately $8 billion per year.
As the variant subsided in the second half of the quarter and employees returned from leave, we quickly transitioned from being understaffed to being overstaffed, resulting in lower productivity. This lower productivity added approximately $2 billion in costs compared to last year. In the last few weeks of the quarter and into April, we’ve seen productivity improvements across the network, and we expect to reduce these cost headwinds in Q2.” – CFO
Delivering costs and labor costs total about $10 billion in higher overall costs but labor productivity is starting to improve again.
Now that demand patterns have stabilized, we see an opportunity to better match our capacity to demand. We have lowered our operations, and capital expenditures for 2022 and are evaluating other ways to increase our fixed cost leverage. We estimate that this overcapacity, coupled with the extraordinary leverage we saw in Q1 of last year, resulted in $2 billion of additional costs year-over-year in Q1.” – CFO
Temporary overcapacity is adding $8 billion in annual costs, though this is not wasted spending, because Amazon needed that capacity to keep growing at incredible rates in the future.
We do expect the effects of these fixed cost leverage to persist for the next several quarters as we grow into this capacity. When you combine the impacts of the externally driven costs and the internally controllable costs, you get approximately $6 billion in incremental costs for the quarter.” – CFO
Factoring in the cost mitigation protocols AMZN is putting in place, in total costs were up $6 billion for the quarter, or $24 billion per year.
Our guidance includes an expectation that we will incur approximately $4 billion of these incremental costs in Q2.” – CFO
By Q2 AMZN expects those extra costs to decline to $4 billion per quarter or $16 billion per year.
(Source: FactSet Research Terminal)
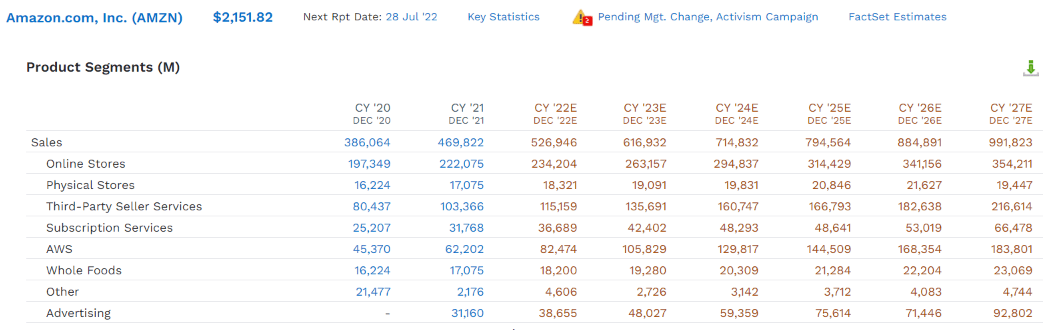
Amazon’s 2027 sales consensus fell from $1.02 trillion to $992 billion.
so now Amazon is expected to become the first $1 trillion sales company in 2028 instead of 2027
It’s expected to deliver modest to incredible growth across all its operating units.
20% growth in AWS through 2027
20% growth in advertising
13% growth in subscriptions (Prime)
13% growth in 3rd party sales
8% growth in its own online stores
(Source: earnings presentation)
AWS continues to grow like a weed
operating margins up to 35%
57% growth in operating income at AWS
margins are expanding despite AWS cutting prices (economies of scale)
Why not just spin off AWS and Advertising to “maximize shareholder value”?
that’s hedge fund thinking, not long-term thinking
retail feeds data into AWS and advertising
AWS and advertising feed data into retail
only by linking the data from every part of the empire, fed into AMZN’s machine learning algos can AMZN truly maximize long-term free cash flow and shareholder value
break up the empire and the sum of the parts is worth significant less
Quantitative Analysis: The Math Backing Up The Investment Thesis
AMZN Credit Ratings
Rating Agency
Credit Rating
30-Year Default/Bankruptcy Risk
Chance of Losing 100% Of Your Investment 1 In
S&P
AA Stable
0.51%
196.1
Fitch
AA- Stable
0.55%
181.8
Moody’s
A1 (A+ equivalent) Stable
0.60%
166.7
Consensus
AA- Stable
0.55%
180.7
(Source: S&P, Moody’s, Fitch)
Rating agencies estimate a 0.55% fundamental risk in buying Amazon today.
1 in 181 chance of losing all your money over the next 30 years
AMZN Leverage Consensus Forecast
Year
Debt/EBITDA
Net Debt/EBITDA (3.0 Or Less Safe According To Credit Rating Agencies)
Interest Coverage (8+ Safe)
2020
0.56
-0.09
13.90
2021
0.68
-0.28
13.75
2022
0.69
-0.17
10.08
2023
0.53
-0.35
16.85
2024
0.40
-0.54
28.58
2025
0.31
-0.71
39.64
2026
0.25
-1.21
52.74
2027
0.21
-1.42
66.80
Annualized Change
-13.11%
48.56%
25.13%
(Source: FactSet Research Terminal)
Amazon has more cash than debt already and its balance sheet is expected to get rapidly stronger over time.
AMZN Balance Sheet Consensus Forecast
Year
Total Debt (Millions)
Cash
Net Debt (Millions)
Interest Cost (Millions)
EBITDA (Millions)
Operating Income (Millions)
2020
$31,816
$42,122
-$5,079
$1,647
$57,284
$22,899
2021
$48,744
$36,220
-$20,346
$1,809
$71,994
$24,879
2022
$51,314
$67,329
-$12,998
$2,018
$74,672
$20,345
2023
$51,124
$100,528
-$33,812
$2,197
$96,394
$37,029
2024
$48,945
$144,188
-$65,061
$2,096
$120,978
$59,909
2025
$47,108
$270,216
-$107,346
$1,933
$151,014
$76,631
2026
$47,108
$404,329
-$229,430
$1,979
$189,824
$104,379
2027
$46,691
$502,633
-$318,442
$2,029
$224,882
$135,533
Annualized Growth
5.63%
42.50%
80.61%
3.02%
21.58%
28.92%
(Source: FactSet Research Terminal)
cash position growing at 43% CAGR
net cash growing at 81% CAGR
cash flows growing at 22% to 29% CAGR
by 2027 an estimated $318 billion in net cash
$503 billion in total cash
Apple began the largest capital return in history at $250 billion in cash
well-staggered bond maturities, no trouble refinancing maturing debt
1.64% average borrowing cost vs bond market’s 2.55% long-term inflation forecast
AMZN’s effective real interest rate is -0.8% vs 12.8% return on invested capital
AMZN Credit Default SWAP Spreads: Bond Market’s Real-Time Fundamental Risk Assessment
(Source: FactSet Research Terminal)
Credit default swaps are insurance against bond defaults, and thus represent a real-time bond market estimate of a company’s short and medium-term bankruptcy risk.
AMZN’s CDS is relatively stable over time.
note how stable AMZN’s fundamental risk is compared to the stock price
analysts, rating agencies, and the bond market all agree the thesis remains intact
Bond investors are saying “buy with confidence”
AMZN GF Score: The Newest Addition To The DK Safety And Quality Model
The GF Score is a ranking system that has been found to be closely correlated to the long-term performances of stocks by backtesting from 2006 to 2021.” – Gurufocus
GF Score takes five key aspects into consideration. They are:
Financial Strength
Profitability
Growth
Valuation
Momentum
(Source: Gurufocus Premium)
AMZN’s exceptionally strong 92/100 GF score confirms its excellent fundamentals as well as attractive valuation.
An industry leader in financial strength, profitability, growth, and valuation.
AMZN’s profitability is historically within the top 10% of chipmakers.
AMZN Trailing 12-Month Profitability Vs Peers
Metric
Industry Percentile
Major Cyclical Retailers More Profitable Than AMZN (Out Of 1,122)
Gross Margins
11.13
997
Operating Margin
48.02
583
Net Margin
61.55
431
Return On Equity
75.21
278
Return On Assets
66.58
375
Returns On Invested Capital
62.77
418
Return On Capital
52.56
532
Return On Capital Employed
58.96
460
Average
60.81
440
(Source: Gurufocus Premium)
Profitability has been hurt by that $6 billion in extra costs in Q1 but remains above average.
Over the last 20 years, AMZN’s industry-leading profitability has been stable or improving, confirming a wide and stable moat.
the recent decline in profitability isn’t expected to last long
AMZN Margin Consensus Forecast
Year
FCF Margin
EBITDA Margin
EBIT (Operating) Margin
Net Margin
Return On Capital Expansion
Return On Capital Forecast
2020
8.0%
14.8%
5.9%
5.5%
2.58
2021
-1.9%
15.3%
5.3%
7.1%
TTM ROC
12.53%
2022
2.6%
14.2%
3.9%
2.1%
Latest ROC
NA
2023
6.0%
15.6%
6.0%
4.8%
2027 ROC
32.33%
2024
8.2%
16.9%
8.4%
6.5%
2027 ROC
NA
2025
9.3%
19.0%
9.6%
7.9%
Average
32.33%
2026
15.4%
21.5%
11.8%
10.3%
Industry Median
11.69%
2027
17.1%
22.7%
13.7%
12.0%
AMZN/Industry Median
2.77
Annualized Growth
11.41%
6.24%
12.66%
11.70%
Vs S&P
2.21
Annualized Growth (Ignoring Pandemic)
NA
6.75%
17.12%
9.12%
(Source: FactSet Research Terminal)
Compared to 2020 AMZN’s free cash flow margins are expected to more than double by 2027.
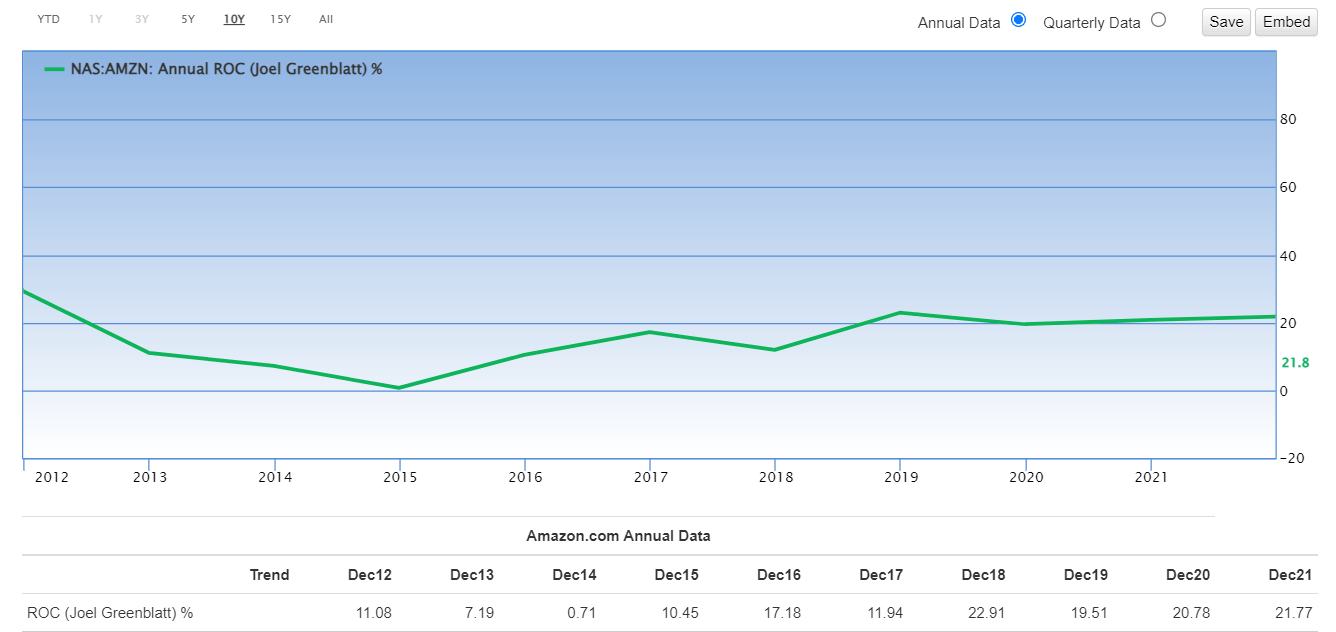
Return on capital is pre-tax profit/operating capital (the money it takes to run the business).
Joel Greenblatt’s gold standard proxy for quality and moatiness
Analysts are expecting ROC to nearly triple by 2027.
and achieve almost 3X the industry norm
and more than 2X the S&P 500
AMZN’s ROC Has Been Stable For A Decade
(Source: Gurufocus Premium)
AMZN’s ability to sustain industry-leading profitability over the decades despite all its challenges and risks confirms a wide and stable moat.
Reason Four: Amazing Growth Prospects As Far As The Eye Can See
Amazon’s profitability has been hurt in the short term by its recent successful efforts to double capacity within two years.
Amazon CEO Andy Jassy said the company is focused on returning to a “healthy level of profitability” after slowing retail sales and rising costs ate into its latest quarterly earnings. We have effectively lowered our cost structure before and I have high confidence that we’ll get back on track as we work through these incredibly unusual past two years,” Jassy said Wednesday at Amazon’s annual shareholder meeting, his first since taking the helm from founder Jeff Bezos in July.” – CNBC
But cost controls doesn’t mean Amazon is done investing in future growth.
Far from it.
AMZN Growth Spending Consensus Forecast
Year
SG&A (Selling, General, Administrative)
R&D
Capex
Total Growth Spending
Sales
Growth Spending/Sales
2021
$41,374
$49,407
$55,396
$146,177
$469,822
31.11%
2022
$46,372
$61,509
$60,135
$168,016
$526,946
31.88%
2023
$52,714
$7,117
$62,118
$121,949
$616,932
19.77%
2024
$57,813
$78,921
$65,778
$202,512
$714,832
28.33%
2025
$63,506
$78,372
$69,493
$211,371
$794,564
26.60%
2026
$69,895
$86,060
$65,697
$221,652
$884,891
25.05%
2027
$75,749
$95,014
$69,052
$239,815
$991,823
24.18%
Annualized Growth
10.61%
11.51%
3.74%
8.60%
13.26%
-4.12%
Total Spending 2022 To 2027
$366,049
$406,993
$392,273
$1,165,315
$4,529,988
NA
(Source: FactSet Research Terminal)
AMZN is increasing its growth spending by 9% per year, from $146 billion in 2021 to almost a quarter of a trillion in 2027.
almost $100 billion in R&D alone in 2027
$4.5 trillion in cumulative sales over the next six years
$1.2 trillion in cumulative growth spending in the next six years
For context, the US government is planning on spending $1.2 trillion on infrastructure in the next 10 years.
Amazon is spending more on growth than the US government
AMZN Medium-Term Growth Consensus Forecast
Year
Sales
Free Cash Flow
EBITDA
EBIT (Operating Income)
Net Income
2020
$386,064
$31,018
$57,284
$22,899
$21,331
2021
$469,822
-$9,069
$71,994
$24,879
$33,364
2022
$526,946
$13,876
$74,672
$20,345
$10,896
2023
$616,932
$36,748
$96,394
$37,029
$29,466
2024
$714,832
$58,752
$120,978
$59,909
$46,298
2025
$794,564
$73,814
$151,014
$76,631
$62,937
2026
$884,891
$136,088
$189,824
$104,379
$91,207
2027
$991,823
$169,771
$224,882
$135,533
$118,922
Annualized Growth
14.43%
27.49%
21.58%
28.92%
27.82%
Annualized Growth (Ignoring Pandemic)
13.26%
NA
20.90%
32.65%
23.59%
Cumulative Over The Next 6 Years
$4,529,988
$489,049
$857,764
$433,826
$359,726
(Source: FactSet Research Terminal)
Amazon’s growth is astounding given its size.
13% sales growth outside of the pandemic on a base of nearly $500 billion in revenue
free cash low growing almost 30% per year
bottom line growing at 21% to 33% per year
Amazon is expected to generate $170 billion in free cash flow in 2027 alone.
And almost $500 billion in free cash flow over the next six years.
there has never been a growth stock like Amazon
this level of growth is unprecedented in human history
AMZN Dividend Growth/Buy Back Consensus Forecast
Year
Dividend Consensus
FCF/Share Consensus
FCF Payout Ratio
Retained (Post-Dividend) Free Cash Flow
Buyback Potential
Debt Repayment Potential
2022
$0.00
$15.11
0.0%
$7,691
0.70%
15.8%
2023
$0.00
$65.47
0.0%
$33,324
3.04%
64.9%
2024
$0.00
$131.66
0.0%
$67,015
6.12%
130.6%
2025
$0.00
$194.94
0.0%
$99,224
9.06%
194.1%
2026
$0.00
$252.28
0.0%
$128,411
11.73%
262.4%
2027
$0.00
$311.06
0.0%
$158,330
14.46%
336.1%
Total 2022 Through 2024
$0.00
$970.52
0.0%
$493,994.68
45.13%
962.69%
Annualized Rate
NA
83.11%
NA
83.11%
83.11%
84.37%
(Source: FactSet Research Terminal)
Amazon isn’t expected to pay a dividend for the foreseeable future.
However, $494 billion in cumulative retained free cash flow has to go somewhere.
enough to pay back its debt more than 10X over
$10 billion buyback authorization is a drop in the bucket of what’s needed
AMZN could repurchase nearly half its shares at current valuations
$2.7 billion is the buyback consensus for 2022
likely to be overly conservative given AMZN’s incredible discount to fair value
AMZN Long-Term Growth Outlook
20-year growth rate: 32% CAGR
consensus growth range (5 sources): 19.1% to 40.5% CAGR
individual analyst growth range: 4.9% to 36.0% CAGR
median growth consensus from all analysts: 21.7% CAGR
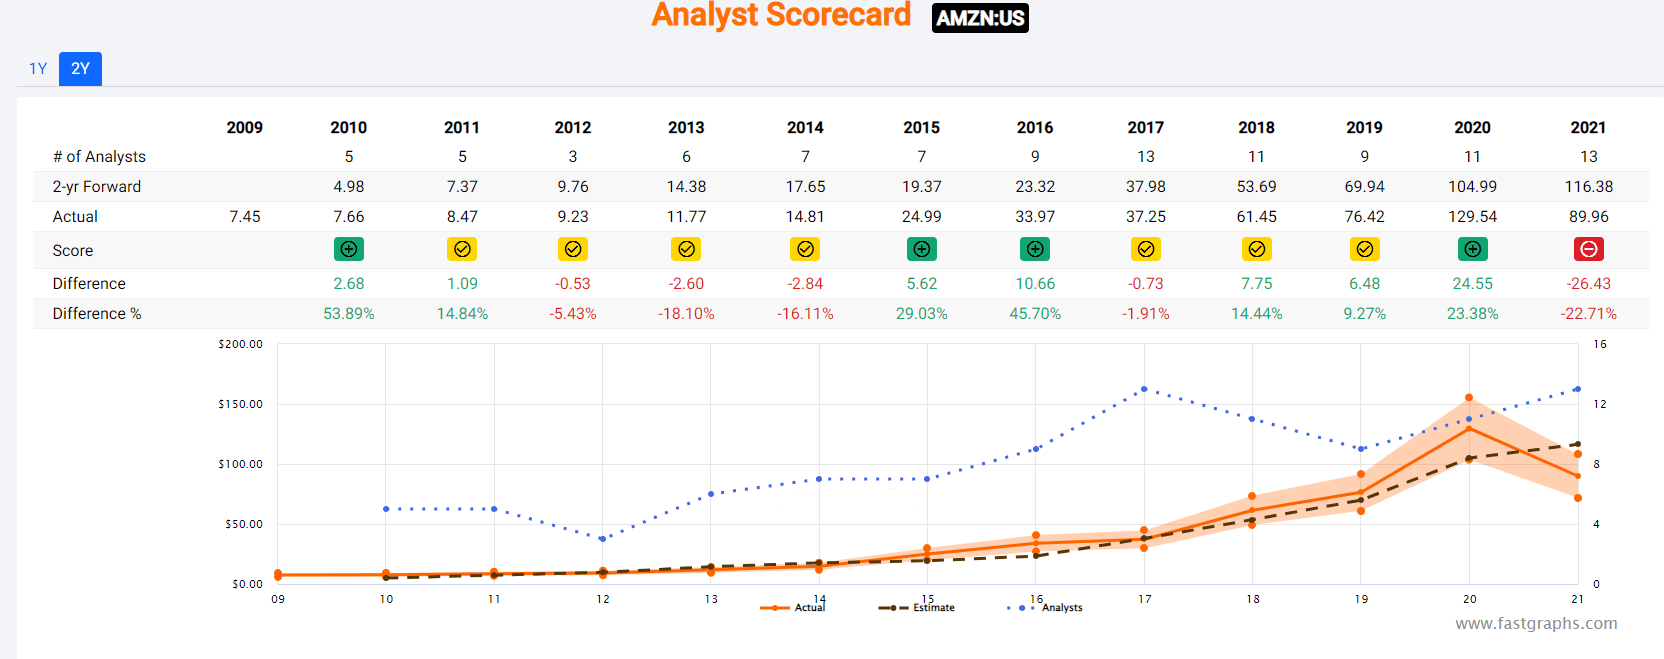
How accurate are analysts at forecasting AMZN’s growth over time?
FAST Graphs, FactSet
FAST Graphs, FactSet
Smoothing for outliers analyst margins of error are 20% to the downside and 30% to the upside.
15% to 41% CAGR adjusted growth consensus range
70% statistical probability AMZN grows at 15% to 41% over time
Analysts expect AMZN’s growth to be similar to the last 12 years. And the company’s numerous growth catalysts make that forecast reasonable.
Reason Five: The Best Valuation In 7 Years
For 20 years, outside of bear markets and bubbles, billions of investors have paid 25X to 27X cash flow for Amazon.
a 91% statistical probability that about 26X cash flow is intrinsic value for AMZN
Metric
Historical Fair Value Multiples (14 Years)
2022
2023
2024
2025
12-Month Forward Fair Value
Operating Cash Flow
25.98
$3,371.68
$4,800.06
$6,943.93
$8,089.39
Average
$3,371.68
$4,800.06
$6,943.93
$8,089.39
$3,921.06
Current Price
$2,151.82
Discount To Fair Value
36.18%
55.17%
69.01%
73.40%
45.12%
Upside To Fair Value
56.69%
123.07%
222.70%
275.93%
82.22%
2022 OCF
2023 OCF
2023 Weighted OCF
12-Month Forward OCF
12-Month Average Fair Value Forward P/OCF
Current Forward P/OCF
$129.78
$184.76
$71.06
$150.93
26.0
14.3
AMZN at 14.3X forward cash flow is a 45% screaming bargain.
15.6X cash-adjusted earnings
not just growth at a reasonable price, but hyper-growth at a highly attractive price
Analyst Median 12-Month Price Target
Morningstar Fair Value Estimate
$3,648.18 (24.2X cash flow)
$3,850.00 (25.5X cash flow)
Discount To Price Target (Not A Fair Value Estimate)
Discount To Fair Value
41.02%
44.11%
Upside To Price Target
Upside To Fair Value
69.54%
78.92%
Morningstar’s discounted cash flow model works out to 25.5X cash flow, in-line with ours and historical fair value.
Analysts expect AMZN to trade at 24.2X cash flow in 1 year, delivering 70% returns in the next 12 months.
I don’t care about 12-month return forecasts, but whether the margin of safety is enough to compensate for AMZN’s risk profile.
Rating
Margin Of Safety For Medium-Risk 13/13 Ultra SWAN quality companies
2022 Price
2023 Price
12-Month Forward Fair Value
Potentially Reasonable Buy
0%
$3,371.68
$4,800.06
$3,921.06
Potentially Good Buy
5%
$3,203.10
$4,560.06
$3,725.01
Potentially Strong Buy
15%
$2,865.93
$4,080.06
$3,332.90
Potentially Very Strong Buy
25%
$2,402.33
$3,600.05
$2,940.80
Potentially Ultra-Value Buy
35%
$2,191.59
$3,120.04
$2,548.69
Currently
$2,151.82
36.18%
55.17%
45.12%
Upside To Fair Value (Not Including Dividends)
56.69%
123.07%
82.22%
For anyone comfortable with its risk profile, AMZN is a potentially Ultra Value strong buy.
Risk Profile: Why Amazon Isn’t Right For Everyone
There are no risk-free companies and no company is right for everyone. You have to be comfortable with the fundamental risk profile.
What Could Cause AMZN’s Investment Thesis To Break
safety falls to 40% or less
balance sheet collapses (highly unlikely, 0.55% probability according to S&P)
Government breakup
AWS market share collapses
Advertising business is destroyed by regulations that ban the usage of user data
growth outlook falls to less than 10% for seven years
AMZN’s role in my portfolio is to deliver long-term 10+% returns with minimal fundamental risk
How long it takes for a company’s investment thesis to break depends on the quality of the company.
Quality
Years For The Thesis To Break Entirely
Below-Average
1
Average
2
Above-Average
3
Blue-Chip
4
SWAN
5
Super SWAN
6
Ultra SWAN
7
100% Quality Companies (MSFT, LOW, and MA)
8
These are my personal rule of thumb for when to sell a stock if the investment thesis has broken.
AMZN is highly unlikely to suffer such catastrophic declines in fundamentals.
AMZN’s Risk Profile Includes
inherent cyclicality of retail with the economy
disruption risk (nearly 1,000 major competitors globally) including MSFT FB, and GOOG in its most important businesses
political/regulatory risk – anti-trust risk domestically and globally
global expansion risk (not as easy to disrupt foreign markets with entrenched giants)
new market penetration risk: healthcare especially is a very highly regulated and challenging industry to disrupt
M&A execution risk
labor retention risk (tightest job market in over 50 years and finance is a high paying industry)
Labor relations risk: the introduction of unions could increase labor expenses by approximately $150 million per 1% of the workforce (up to $15 billion per year)
cybersecurity risk: hackers and ransomware
currency risk: almost 40% of sales are from outside the US
By itself, the New York unionization is estimated to represent a ~$200M or less hit to AMZN’s Opex tally or a ~0.4% reduction to 2023 EBIT. While a rapid trend towards unionization is not anticipated, if applied to AMZN’s broader 750,000 U.S. fulfillment/transportation workforce, every 1% of employees that unionize is estimated to add an incremental ~$150M to annual Opex.” – Seeking Alpha
This single fulfillment center won’t have a meaningful impact on AMZN’s costs but if it were to represent a new trend then AMZN’s margin expansion forecasts could come down a bit.
How do we quantify, monitor, and track such a complex risk profile? By doing what big institutions do.
Long-Term Risk Analysis: How Large Institutions Measure Total Risk
see the risk section of this video to get an in-depth view (and link to two reports) of how DK and big institutions measure long-term risk management by companies
AMZN Long-Term Risk Management Consensus
Rating Agency
Industry Percentile
Rating Agency Classification
MSCI 37 Metric Model
48.0%
BBB, Average, Positive Trend
Morningstar/Sustainalytics 20 Metric Model
1.8%
30.2/100 high-Risk
Reuters’/Refinitiv 500+ Metric Model
100.0%
Excellent, #1 Industry Leader
S&P 1,000+ Metric Model
25.0%
Poor, Stable Trend
Just Capital 19 Metric Model
84.9%
Very Good
FactSet
30.0%
Industry Leader, Positive Trend
Morningstar Global Percentile (All 15,000 Rated Companies)
37.2%
Below-Average, Stable Trend
Just Capital Global Percentile (All 954 Rated US Companies)
89.0%
Very Good, bordering on exceptional
Consensus
52%
Medium-Risk, Average Risk-Management, Stable Trend
(Sources: MSCI, Morningstar, S&P, FactSet)
AMZN’s Long-Term Risk Management Is The 349th Best In The Master List (30th Percentile)
Classification
Average Consensus LT Risk-Management Industry Percentile
Risk-Management Rating
S&P Global (SPGI) #1 Risk Management In The Master List
94
Exceptional
Strong ESG Stocks
78
Good – Bordering On Very Good
Foreign Dividend Stocks
75
Good
Ultra SWANs
71
Good
Low Volatility Stocks
68
Above-Average
Dividend Aristocrats
67
Above-Average
Dividend Kings
63
Above-Average
Master List average
62
Above-Average
Hyper-Growth stocks
61
Above-Average
Monthly Dividend Stocks
60
Above-Average
Dividend Champions
57
Average
Amazon
52
Average
(Source: DK Research Terminal)
AMZN’s risk-management consensus is in the bottom 30% of the world’s highest quality companies and similar to that of such other blue-chips as
The bottom line is that all companies have risks, and AMZN is average at managing theirs.
How We Monitor AMZN’s Risk Profile
53 analysts
3 credit rating agencies
8 total risk rating agencies
61 experts who collectively know this business better than anyone other than management
and the bond market for real-time fundamental risk assessments
When the facts change, I change my mind. What do you do sir?” – John Maynard Keynes
There are no sacred cows at iREIT or Dividend Kings. Wherever the fundamentals lead we always follow. That’s the essence of disciplined financial science, the math behind retiring rich and staying rich in retirement.
Bottom Line: It’s The Best Time In 7 Years To Buy Amazon
I’m not a market timer, and I can’t tell you when this bear market will end.
Time Frame
Historically Average Bear Market Bottom
Non-Recessionary Bear Markets Since 1965
-21% (Achieved May 20th, 2020)
Median Recessionary Bear Market Since WWII
-24%
Non-Recessionary Bear Markets Since 1928
-26%
Bear Markets Since WWII
-30%
Recessionary Bear Markets Since 1965
-36%
All 140 Bear Markets Since 1792
-37%
Average Recessionary Bear Market Since 1928
-40%
(Sources: Ben Carlson, Bank of America, Oxford Economics, Goldman Sachs)
That will depend on what happens with the economy and interest rates, over the next two years.
There are a lot of short-term risks to the economy in the short-term, the biggest one is persistently high inflation.
For example, JPMorgan recently forecast that US gasoline prices could hit $6.20 in August.
And that doesn’t factor in the possibility of oil prices rising to $150 according to Bank of America if China ends its COVID-zero policy and reopens its economy.
Combined with high housing inflation and food inflation, as well as an insatiable demand for travel this summer, it’s possible that inflation doesn’t come down as fast as economists expect.
the consensus is that inflation falls by 0.2% per month through the end of the year, to 6.9% by December.
and then falls 0.33% per month next year down to 2.8% by the end of 2023
Deutsche Bank’s base case forecast is that high inflation forces the Fed to raise interest rates to 5% to 6% by mid-2023.
continuous 0.5% hikes at every meeting
Bridgewater, the world’s largest hedge fund, thinks that to beat inflation the Fed would have to raise rates to 5.5%.
triggering a severe recession
and a 40% S&P 500 crash
Deutsche Bank also thinks a severe recession could be coming in late 2023 (ending in mid-2024).
and they also think it would result in a 40% peak decline in the S&P 500
Morgan Stanley’s base case forecast is that we avoid a recession but its blue-chip economist team thinks the S&P bottoms this summer at 3,400, a 29% peak decline.
they think the S&P trades relatively flat at 3,900 a year from now
In a worst-case scenario, Morgan Stanley thinks stocks could bottom at -40%, at which point credit markets would be at risk of freezing up and forcing the Fed to pivot to avoid another financial crisis and Great Depression.
What’s my point? A lot could still go wrong with the economy and the stock market.
BUT predictions of mega crashes of 60% or more are largely overblown.
For example, even Michael Burry, whose proprietary model says the S&P 500 MIGHT fall 61% over two to three years, is BUYING tech stocks TODAY.
GOOG and FB most aggressively
Jeremy Grantham’s GMO also thinks that stocks COULD fall as much as 60% over three years.
but GMO is investing client money into energy stocks TODAY
and Grantham is recommending investors buy quality oil stocks and deep value TODAY
Even Robert Kiyosaki, the most alarmist permabear of all (a 90+% crash is coming soon according to him) is recommending buying things TODAY.
Gold
Food
Guns
Bitcoin (a most interesting recommendation given that crypto is highly correlated to stocks and he thinks stocks are going to crash 90%).
None of us know what the future holds but to be a long-term investor requires optimism that a brighter future is coming at some point.
A 42% crash in Amazon stock has a lot of investors scared, even terrified.
But after careful analysis of AMZN’s fundamentals, past, present, and consensus future, management, analysts, rating agencies, and the bond market are clear on one thing.
Amazon’s investment thesis remains firmly intact.
And shares are about 45% undervalued, the best valuation in seven years.
I am NOT saying to go “all in” on Amazon because it is absolutely at the bottom.
I am saying that if you don’t buy SOME Amazon at the best valuation in seven years you shouldn’t consider buying this company ever.
no company is right for everyone
and only those comfortable with its risk profile should ever own this company
I’ve been buying Amazon steadily in this bear market.
And as long as its fundamentals remain intact, I will continue doing so.
Not just because it has the potential to 6X in the next five years.
Not just because it’s expected to soon become the largest company in history by sales.
Not just because AWS today is worth more than the entire market cap of the company (you’re getting advertising and all other parts of the business for free).
I’m not buying Amazon because analysts think it could deliver 70% returns in a year (82% justified by fundamentals).
I’m not buying it to try to earn 12X the market’s expected returns through 2027.
I’m buying Amazon to own it for decades because it literally offers Buffett-like return potential for the next decade or more.
Amazon is not just the greatest growth story of our age, it remains a potential rich retirement dream stock.
And at these valuations? No matter where it ultimately bottoms, I can say one thing with 80% absolute certainty.
Anyone buying Amazon today is likely to feel like a stock market genus in 5+ years.
Jetty, the financial services company on a mission to make renting a home more affordable and flexible, today announced an investment from PayPal Ventures and Experian Ventures.
The new funding will enable Jetty to accelerate the growth of its existing suite of products and invest in product expansion.
Jetty aims to support renters and properties at every stage of the rental journey, with current product offerings, including Jetty Deposit, a security deposit alternative; Jetty Rent, a flexible rent payment program; and Jetty Protect, a modern renters insurance product. Jetty’s network of property owners and operators own and manage millions of rental units across the country.
“We believe that working with the most respected names in financial services is the fastest and most effective way to help us achieve our vision,” said Mike Rudoy, Co-Founder and CEO at Jetty. “Beyond additional capital, this investment gives us access to a new toolset to improve our current products and bring new solutions to market. Demand for renter-focused financial services has never been greater and we remain focused on alleviating the financial pain being felt by renters across the country.”
This new funding will support the launch of Jetty Credit, a new credit building service that will facilitate the reporting of rent payments to credit bureaus to provide additional data that could help renters boost their credit scores. This new addition is being designed to seamlessly interact with all other products on the Jetty platform, giving renters and property managers a simple, all-in-one solution.
“Jetty and PayPal share a common mission: democratizing access to financial services,” said Rachel Zabronsky, Investor at PayPal Ventures. “We’re excited by Jetty’s ambitions to reimagine renting, making it a better, more accessible experience from move-in to move-out. As Jetty enters its next stage of growth, we’re looking forward to supporting their success.”
“We are committed to identifying and working alongside companies that empower consumers and support Jetty’s aim to improve the financial lives of renters,” said Alpa Lally, Vice President Data Business for Experian Consumer Information Services. “We look forward to working with the team to help expand their core business and develop their new tool to help consumers build credit.”
The PayPal Ventures and Experian Ventures investment follows another investment from Wilshire Lane Capital and Morgan Properties announced by Jetty in February 2022.
Mastercard, a technology leader in the global payments industry, has announced a strategic partnership Saudi Arabia-based HyperPay, the fastest growing e-commerce payments services provider in the Middle East and North Africa (MENA), to drive the adoption of digital payment solutions across the region.
As part of the partnership, Mastercard will make a strategic investment in HyperPay to continue enhancing the delivery of its proven capabilities and identify new technologies that can be applied to practical use cases. Mastercard’s multi-rail approach is about leading payment innovation across multiple payment rails, adding value and connecting information, while enabling people and organizations to transact across any channel and to any end point.
The collaboration will offer advanced new technologies so businesses, governments and SMEs can move from cash-based payments to an improved, frictionless, and seamless ecosystem utilizing the innovative capabilities of both Mastercard and HyperPay.
Dimitrios Dosis, President, Eastern Europe, Middle East and Africa, Mastercard, said: “Growing the payment ecosystem is crucial for the development of a robust digital economy that is more inclusive for all. We are thrilled to enter this partnership with HyperPay as we work together to offer consumers access to innovative, seamless and secure payment solutions.
Mastercard Leads $40 Million Round In Saudi Arabia’s Hyperpay
“With this shared vision, Mastercard and HyperPay have the opportunity to unlock the region’s potential by using technology to pave the way for a streamlined, efficient and more inclusive future.”
Muhannad Ebwini, Founder and CEO of HyperPay, said: “Forging strong partnerships has been part of our mission since day one and we are delighted to announce this collaboration with Mastercard. We are committed to fast-track our expansion beyond payments, to deliver a complete suite of financial products.
“We have dealt with the challenges businesses face when it comes to accepting digital payments and are building products that meet the evolving needs of our platform customers across all verticals. Ecommerce will continue to grow, as relying more on digital platforms for shopping becomes the optimum way for consumers around the world to shop and simplified payment solutions will enable the delivery of frictionless consumer experiences.”
Mastercard’s Economic Outlook 2022 estimated that 20% of the digital shift in retail would stay put. Furthermore, recent studies from Mastercard showed that 61% of MENA consumers say they would avoid businesses that do not accept electronic payments of any kind.
As a leading technology provider and enabler for digital first-use cases, Mastercard along with its fintech partners, is continuing to support the digital payments and virtual banking ecosystems across the region. This is part of Mastercard’s broader multi-rail strategy to support payment innovation in the region across all digital payment rails, enabling people and organizations to send and receive money how, where, and when they choose, across both card and account-to-account payments rails.
The store stocks a selection of women’s and men’s apparel, shoes and accessories from well-known brand such as Calvin Klein, Lacoste and Levi’s as well as from new and emerging designers.
Amazon Style doesn’t use the company’s cashierless ‘Just Walk Out’ technoligy found in Amazon Fresh and Whole Foods locations, instead opting for Amazon’s Amazon One palm recognition service.
Amazon previously stated that the clothing store is built around personalisation, with machine learning algorithms producing tailored, real-time recommendations for each customer as they shop. As customers browse the store and scan items that catch their eye, Amazon can recommend picks just for them. For a more tailored experience, customers can share information like their style, fit and other preferences.
According to The Verge, each article of clothing inside the store features a QR code that customers can scan to curate a list of clothing they would like to try on in a fitting room or send straight to pick up for purchase. Another feature is that shoppers can pick clothes on Amazon.com, have them delivered to the store to try them on, and return an item right there if it isn’t to their liking.
Amazon Style fitting rooms include touchscreens where customers can continue to shop. Using the touchscreen, they can rate items to get new picks in real time and request more styles and sizes to be delivered to their fitting room closet in just minutes.
Source: Amazon
In addition to Amazon Style’s selection of items available for in-store purchase, customers can easily find and shop more styles online.
According to Amazon, the fashion store offers more selection than a traditional store of its size, without requiring customers to sift through racks to find the right colour, size and fit. Instead, Amazon Style features display items, in an effort to bring more looks and less clutter to in-store shopping.
“Amazon Style is designed to help customers discover looks they’ll love through a personalised and convenient shopping experience using advanced technology and world-class operations, and our team of employees is dedicated to helping customers find looks they love and feel great in,” Amazon said in a statement.
Citigroup Inc. has entered a partnership with Lagos-based social enterprise Babban Gona to increase lending to local smallholder farmers in a bid to boost agricultural output in Africa’s most populous country.
Babban Gona will administer a $10 million Citigroup Inc. financing to about 41,000 small farmers in the West African nation, it says in an emailed statement. Even though agriculture contributes a third of Nigeria’s economic output, it attracts less than 5% of bank loans.
Part two of Fortune’s video series N3w Lands: An Exploration of the Metaverse explores how creators of all types are using NFTs and crypto technology to make a living in the metaverse economy.
As the managing director and curator of the Museum of Crypto Art, Shivani Mitra has seen artists ranging in age from 14 to 65 use NFT technology to sell their work online and make commissions every time the art is resold on third-party NFT exchanges like OpenSea. In the Museum of Crypto Art, Mitra has helped curate many of these expensive NFTs from notable artists in one place.
“It is one of the greatest hopes for my generation and the generation below me to reverse the course of a political and economic system that has failed them,” Mitra said.
The Metaverse Economy Is The Only Place Hope Exists
In the crypto and NFT-enabled metaverses like Decentraland, Somnium Space, Voxels, and The Sandbox, nearly everything in their virtual worlds exists as an NFT. From land to avatars and clothes avatars wear, ownership of most everything is recorded on a transparent and immutable digital ledger called the blockchain.
The CEO of Everyrealm, Janine Yorio, and her company are at the forefront of using this technology to buy and develop real estate in the metaverse. Among Everyrealm’s more than 100 metaverse real estate developments is a shopping mall in the Decentraland metaverse platform called Metajuku. The project spans the metaverse equivalent of 16,000 square feet and includes retail spaces that Everyrealm rented out to people selling digital clothes for avatars.
“We’ve since realized that when we do things like that, we can create outsized returns for our investors, but we also create content that’s bringing users to the platforms,” Yorio said.
Justin Banon, the co-founder of Boson Protocol, which enables commerce transactions in the metaverse, said every company should have a metaverse strategy.
“Much like web and mobile, now we have the metaverse,” he said.
Boson Protocol created a metaverse marketplace called Boson Portal in Decentraland that has attracted names like Tommy Hilfiger, Hogan, and others that sell what he calls “figital products”—an NFT that is linked to a physical product.
Boson Portal, Banon said, shows that the metaverse is not limited to the interwebs.
In the future, the digital world could mix with the physical world through augmented reality glasses like Microsoft’s HoloLens or the mixed reality glasses Apple is reportedly developing, said John Egan, the CEO of L’atelier BNP Paribas, the digital innovation subsidiary of French bank BNP Paribas.
This technology could bring the metaverse to the real world in promotions for movies or immersive real world environments.
Whatever the future of the metaverse looks like, it’s definitely not going away. Adoption of crypto, NFTs, and the metaverse will allow young people to make a living outside of the traditional economy, which is increasingly stacked against them, he said.
“It is the failure of the post-2008 traditional economy to facilitate upward social mobility for younger people that is driving people towards these new economies, because it’s the only place hope exists.”
One thing that can be said about our phones is that they can be distracting. The average person picks up their phone once every 4 minutes. Other reports show that people check their phones 58 times a day on average, and 30 of these check times occur during working hours.
Regardless of how distracting phones can be, keeping your device locked away during working hours is not an easy feat. In a time of remote and hybrid work, employees need their phones to work efficiently and on-the-go.
Wondering how you can limit distractions while you do productive work on your iPhone? Here are 5 features you should explore on your Apple device:
1. Keep distractions away from the Home Screen
According to Larry Rosen, a psychology professor and author of The Distracted Mind, a great deal of our phone usage is unconscious behaviour. We leave our apps in plain sight, making it easy to mindlessly tap on them. To reduce distraction, keep the apps that distract you away from the Home Screen. To remove apps from your Home Screen:
Long press the app.
Tap on “Remove App.”
Select “Remove from Home Screen.”
If you feel some way about leaving your Home Screen bare, you can leave work-related apps like Slack or Gmail on your homepage.
2. Manage screen time: App Limits and Downtime
The screen time feature controls how much time you spend on your phone and individual apps. This feature allows you to do two things: Enable App Limits and Downtime.
App Limits allows you to set daily or weekly time limits for specific apps like Instagram or an entire category like Social Media.
To enable App Limit
Go to the “Screen Time” menu in the Settings app.
Tap on “App Limits” and select “Add Limit.” You can set limits for an entire app category, or individual apps.
Choose the duration of the limit. You can customize the duration depending on the days. For example, you can limit Instagram to 45 minutes on weekdays and 2 hours on weekends.
The Downtimefeature on the other hand, freezes certain apps at selected times. To enable Downtime
Go to the screen time menu in the settings app and tap on Downtime.
Tap on the “turn on” button
Select “customize days” to customize days and hours for your Downtime.
The downtime tab
3. Notification summary
The ‘Notification Summary’ feature works a bit like a notification digest. Every morning or evening (or any time you choose), you’ll receive a single notification that lists all the notifications from apps you have added to the Summary feature.
To set a notification summary:
Go to the “Notifications” tab in your Settings app.
Tap on “Scheduled Summary”
Enable the “Scheduled Summary” feature.
Select when you get your summary, and the apps you get summary for.
This means that at your chosen time(s), you will get a summary of all notifications from selected apps instead of being distracted by every single notification in real-time.
The scheduled summary tab
4. Enable reader-view Safari
The Reader View in Safari allows you to read a webpage without the distractions of ads and unnecessary page features. Reader View declutters the webpage, making the article easier to focus on. To enable Reader View:
Open the Safari app and navigate to the webpage you want to read.
Tap on the “Aa” icon in the address bar.
Tap on “Show Reader.”
Alternatively, you can long-press the “Aa” icon to switch to Reader View.
An article in normal view vs reader view
5. Enable Focus mode
Think of the Focus feature as a more advanced version of “Do Not Disturb.” This feature not only allows you to stay focused, but also allows you to create different focus levels depending on the event, location, and time.
For example, you can set up a custom Focus for Mondays, and decide what notifications and calls you want to receive. You can also share your focus status, so people who message you are aware that you have your notifications silenced.
To enable Focus:
Go to the “Focus” option in your Settings app
Select the Focus category you want to enable. You can customize it as you please.
The focus tab
There’s an endless list of things we can do and access with our phones. Without deliberate efforts to stay focused and prioritize, it’s easier, now more than ever, to get sucked into the various activities and interactions which they provide us.
The winner of the Nigerian Idol Season 7, Progress Chukwuyem, has applauded the award-winning Bigi carbonated soft drink brand of Rite Foods for the massive role in ensuring the success of the music talent discovery platform, for making it memorable, the fabulous gift offered during the show, and the warm reception accorded him during his visit to the company’s corporate office in Lagos.
The visit by the music Idol and the other 11 contenders of the show, on Thursday, 26 May, 2022, was intended at appreciating Bigi’s immense support for the show and in creating a platform for showcasing his talent which was demonstrated in the 10-weeklong performances that led to his victory, after being refreshed by the brand’s inimitable flavour.
Indeed, the visit was an exciting moment as Progress made known his favourite Bigi variant, from the 13 on the product portfolio, pointing out that the Bigi Orange is his choice of carbonated soft drink, the refreshing and unique taste are what he said shaped his choice. According to him, the orange product stands for fruitfulness which literarily invigorates his stunning performance on stage.
The 21-year-old talented singer, from Ika South of Delta State, won the Idol crown, after defeating Zadok Aghalengbe, age 27, from Edo State, at the grand finale of the show on Sunday, 22 May, to win N100,000,000 (One Hundred Million Naira) worth of prizes.
It includes cash of N30,000,000, a new SUV, a Bigi branded refrigerator and a year’s supply of Bigi drinks, an EP and a music video, a weekend getaway from TravelBeta, and a DStv Explora fully installed with a 12 months premium subscription.
The elated Progress, who was accompanied by the other 11 contestants, after a grand reception, stated that music brought him to the Nigerian Idol show and that he will continue to do it as it is his passion. He will also share it with the world in accordance with the talent inherent in him.
The contemporary gospel and inspirational artiste, who is known for his stunning renditions, avowed that he will be involved in musical acts that will encourage people around the globe that they can always actualise their dreams with a high sense of commitment. Also, to communicate peace, love, and positive change.
He stated that Bigi is a supporter of talent and cares deeply about the well-being of its consumers, just as it did to them during the reality show, and that he would relay that to them and the way it has always been, as a consumer-centric brand. “I give kudos to Bigi for sponsoring the Nigerian Idol,” he remarked.
According to Progress, if Bigi had not sponsored the show, he would not have attained the fame already gotten since he won the musical contest. “Bigi is why the world knows me now and I am glad about that, I thank Bigi for the great support, for making the show worthwhile.”
While encouraging others to put in their best in what they do, especially in a competition like the Nigerian Idol, he said “never look down on yourself and when you get on the stage be truthful to yourself, believe in your vocals and performances, l came as a young man that just sings in the church and right now l am a winner, so never care about the kind of genre you do, continue with it, and it will always be your best.”
On the Bigi powered 10-week show, Rite Foods’ Brand Manager, Boluwatife Adedugbe, pointed out that it is one of the unflinching testimonies of the company’s relentless commitment to strengthening the Nigerian creative industry by discovering and nurturing young talents that will become superstars in their music genres and make the nation proud at global events.
The Bigi variants that have dictated the pace in Nigeria’s beverage sector of the economy includes the Bigi Cola, Bigi Cherry Cola, Bigi Cola (zero sugar), Bigi Ginger Ale, Bigi Orange, Bigi Apple, Bigi Bitter Lemon, Bigi Soda Water, Bigi Lemon & Lime, Bigi Tropical, Bigi Chapman, Bigi Ginger Lemon, and Bigi Tamarind.
We use cookies on our website to give you the most relevant experience by remembering your preferences and repeat visits. By clicking “Accept”, you consent to the use of ALL the cookies.
This website uses cookies to improve your experience while you navigate through the website. Out of these, the cookies that are categorized as necessary are stored on your browser as they are essential for the working of basic functionalities of the website. We also use third-party cookies that help us analyze and understand how you use this website. These cookies will be stored in your browser only with your consent. You also have the option to opt-out of these cookies. But opting out of some of these cookies may affect your browsing experience.
Necessary cookies are absolutely essential for the website to function properly. This category only includes cookies that ensures basic functionalities and security features of the website. These cookies do not store any personal information.
Any cookies that may not be particularly necessary for the website to function and is used specifically to collect user personal data via analytics, ads, other embedded contents are termed as non-necessary cookies. It is mandatory to procure user consent prior to running these cookies on your website.