At one time, HTC was about as bright a star in the industry as a company could be creating such great phones as the Touch Diamond, the Nexus One, the HTC One (M7), and more. Soon, the innovation stopped and so did the profits.
HTC found itself in a cycle that saw it caught in a loop continually spilling red ink and releasing uninspired handsets like the blockchain-focused Exodus 1 and Exodus 2. Maybe in the future making a blockchain phone won’t be such a blockhead move. For now, though, the company needs to get in touch with its past successes.
Earlier this year HTC announced it was building a new flagship phone based on the “metaverse”
Just in case you’re not familiar with the blockchain, it is a system used to keep track of cryptocurrency which makes it nearly impossible to cheat or hack into the system. Earlier this year HTC announced that it was working on a high-end Android phone, its first flagship model since the HTC U12+ in 2018.
HTC’s new handset is reportedly based on the growing”metaverse” trend although such a term could mean anything. There might be some connection between a new high-end HTC handset and the company’s Vive Flow VR headset. There is also speculation that a new HTC phone will support Augmented Reality (AR) apps. The phone was supposed to be unveiled in April but delivery difficulties have forced a delay.
The company might have seen its creative zenith take place in March 2014 when it released the HTC One (M8). The handset’s unique looks garnered plenty of attention and the dual camera setup (for the blurred bokeh backgrounds seen with portrait photos) and pair of front-facing BoomSound speakers added to the phone’s appeal.
But since then, HTC released a series of forgettable models resulting in a flow of red ink. Despite the disappointments, HTC still has its fans who continue to hope that perhaps the next phone will be the one that gets the outfit back on track. And now the new model that was supposed to have been introduced in April has been delayed due to COVID.
How bad has business been for HTC? During April the company had $7 million in sales which was the lowest monthly figure since the company went public in 2002.
HTC sold Google non-exclusive intellectual property related to mobile devices for $1.1 billion in 2017
Let’s take a deeper look into HTC’s plan to deliver a metaverse phone. Oxford Languages defines the word as “a virtual-reality space in which users can interact with a computer-generated environment and other users.” And of course, earlier this year Facebook announced that it was changing the name of the social media firm’s parent company to Meta, short for Metaverse.
HTC’s design prowess arguably peaked with 2014’s HTC One M8
Meta Chairman and CEO Mark Zuckerberg tried to explain the metaverse at the time. He said, “The next platform will be even more immersive — an embodied internet where you’re in the experience, not just looking at it. We call this the metaverse, and it will touch every product we build.” Instead of trying to connect with the catchphrase of the moment, HTC needs to examine what made its phones so popular years ago.
One problem though is that in 2017 a cash-starved HTC sold the non-exclusive rights to some of its non-exclusive intellectual property to Google in a deal valued at $1.1 billion. As part of the deal, HTC employees that worked on smartphones, including the Google Pixel and the soon to be announced Pixel 2 XL, were sent packing to Mountain View to join Google.
This creates the opportunity for conservative income investors to buy attractively valued high-yield blue-chips like Cisco (NASDAQ:CSCO) at prices not seen in years.
So let me show you the four reasons why now is the time to start buying Cisco, the ultimate high-yield tech utility, for your diversified and prudently risk-managed income portfolio.
CSCO’s 35% bear market began when it was trading 36% overvalued with a peak PE of 19.5
Its slow but steady tech utility thesis remains firmly intact.
Metric
2020 Growth Consensus
2021 Growth Consensus
2022 Growth Consensus
2023 Growth Consensus
2024 Growth Consensus
2025 Growth Consensus
Sales
-1%
1%
4%
5%
6%
9%
Dividend
3%
3%
3%
3%
3%
NA
EPS
4%
0%
4%
7%
5%
11%
Operating Cash Flow
2%
1%
-7%
15%
9%
NA
Free Cash Flow
3%
1%
-7%
15%
10%
NA
EBITDA
1%
-2%
27%
1%
5%
NA
EBIT (Operating Income)
2%
-3%
29%
6%
5%
NA
(Source: FAST Graphs, FactSet)
Cisco’s Q3 and Outlook Hampered By Supply Chain Challenges” – Morningstar
Cisco’s third-quarter revenue was flat year over year, as sales were impacted by the war in Ukraine, COVID-19 lockdowns in China, and the prior year’s quarter having an extra week. The company stopped operations in Russia and Belarus in March, which had a 2% impact on growth. Cisco’s third-quarter includes April, which had the start of the latest round of lockdowns in China. Not being able to procure and receive components inhibited the final weeks of the quarter and Cisco’s outlook.” – Morningstar
China is expected to start lifting restrictions in Shanghai on June 1st but supply chain bottlenecks could persist for the rest of the year (assuming unlocking goes to plan).
CSCO Rolling Returns Since 2011 (Dividend Era)
(Source: Portfolio Visualizer Premium)
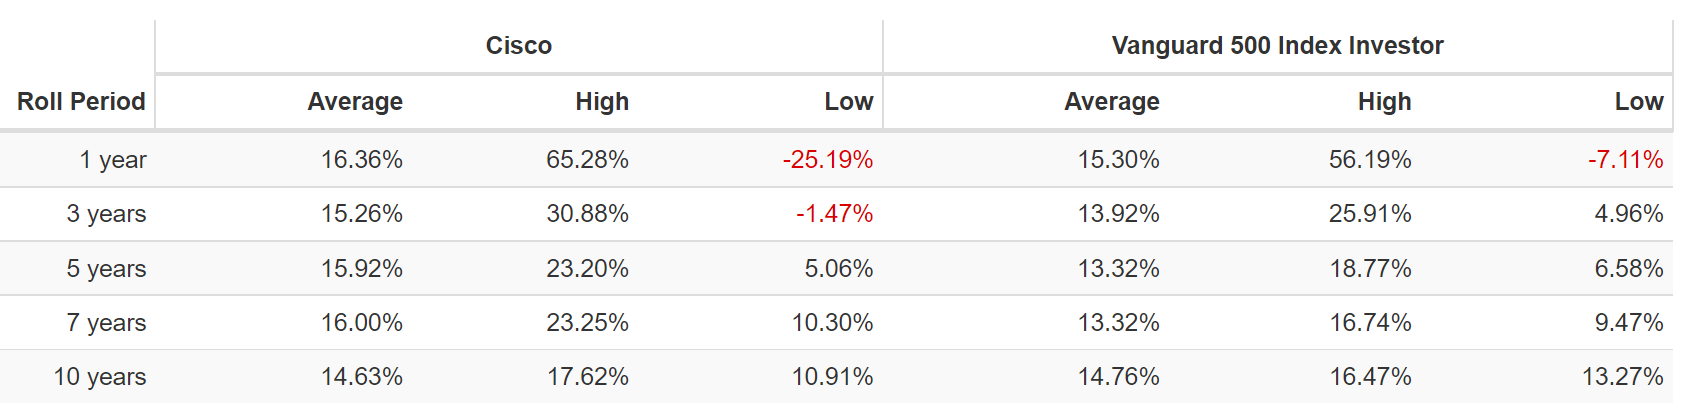
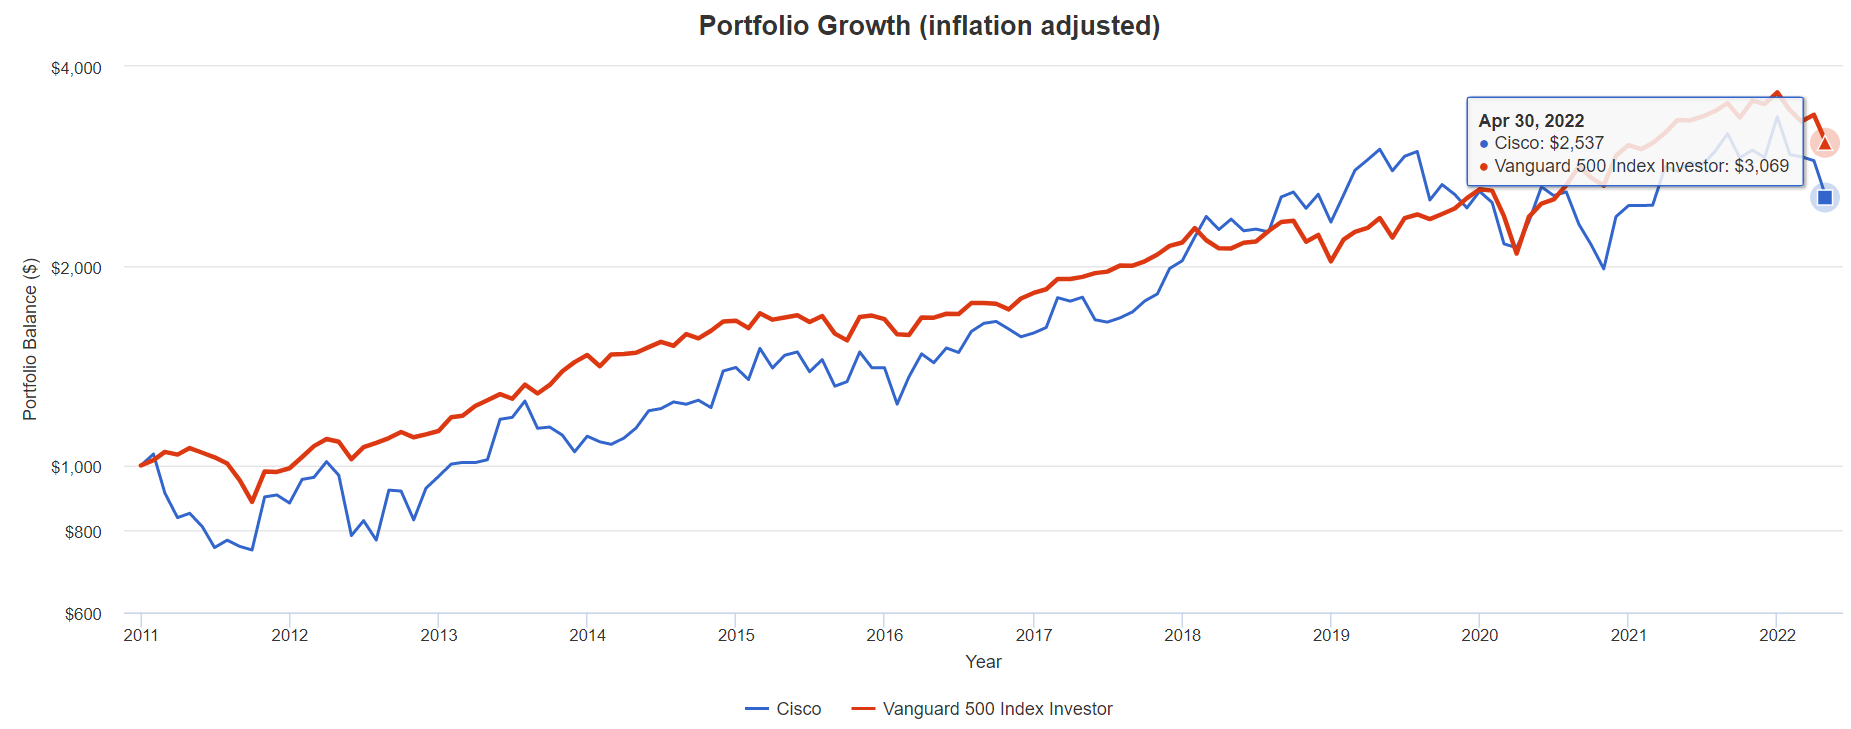
CSCO has delivered very solid returns in the dividend era and is expected to keep slightly exceeding the market in the future.
from bear market bottoms returns as strong as 18% annually over the next 10 years
5X return over a 10 year period
CSCO 2024 Consensus Total Return Potential
(Source: FAST Graphs, FactSet)
(Source: FAST Graphs, FactSet)
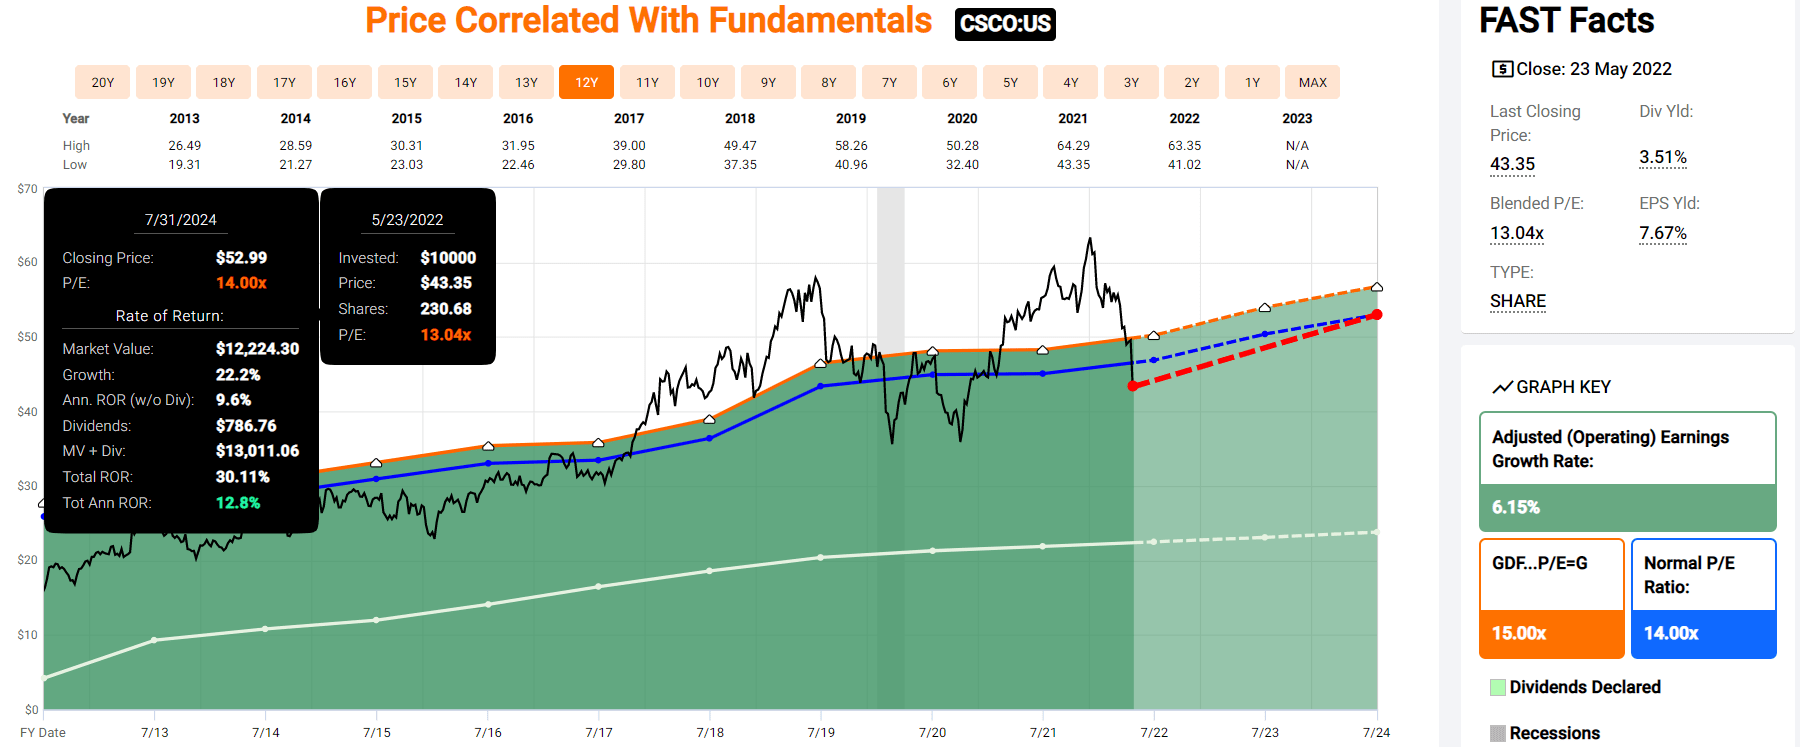
If CSCO grows as analysts expect by 2024 it could deliver 30% total returns or 13% annually.
CSCO 2027 Consensus Total Return Potential
(Source: FAST Graphs, FactSet)
(Source: FAST Graphs, FactSet)
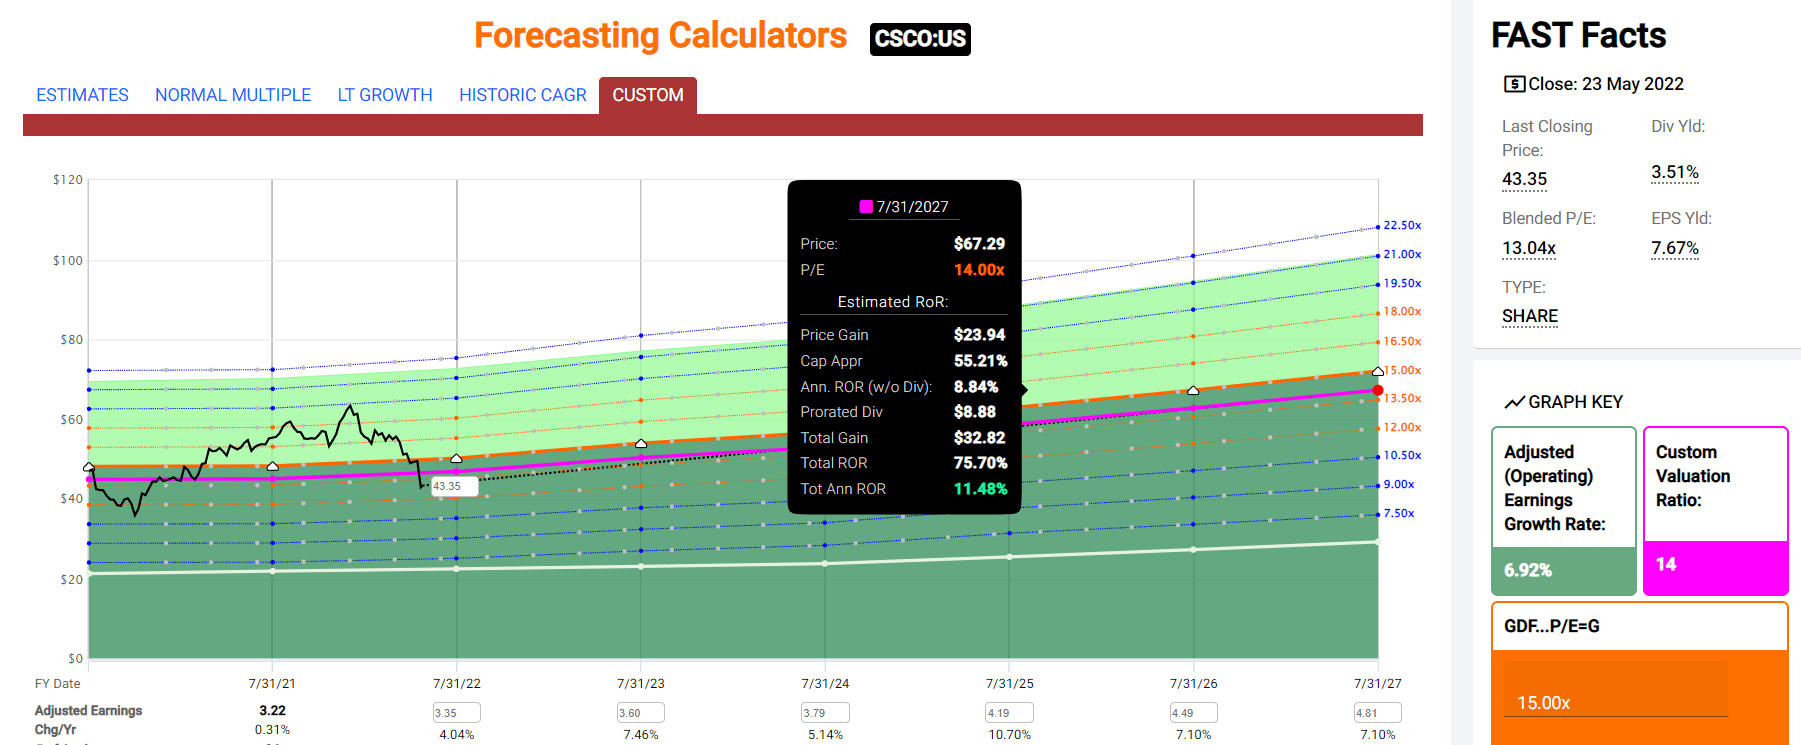
By 2027 if CSCO grows as expected (7% CAGR) and returns to historical fair value, it could deliver 75% total returns or 12% annually.
1.5X the S&P 500
CSCO Long-Term Consensus Total Return Potential
Investment Strategy
Yield
LT Consensus Growth
LT Consensus Total Return Potential
Long-Term Risk-Adjusted Expected Return
Long-Term Inflation And Risk-Adjusted Expected Returns
Years To Double Your Inflation & Risk-Adjusted Wealth
10 Year Inflation And Risk-Adjusted Expected Return
Safe Midstream
5.6%
6.0%
11.6%
8.1%
5.6%
12.9
1.72
Adam’s Planned Correction Buys
4.1%
19.2%
23.3%
16.3%
13.8%
5.2
3.63
Cisco
3.5%
7.10%
10.6%
7.4%
4.9%
14.8
1.61
High-Yield
3.1%
12.7%
15.8%
11.1%
8.5%
8.5
2.26
10-Year US Treasury
2.9%
0.0%
2.9%
2.9%
0.4%
205.7
1.04
REITs
2.8%
6.5%
9.3%
6.5%
4.0%
18.2
1.47
(Sources: Morningstar, FactSet, Ycharts)
CSCO isn’t expected to beat the dividend aristocrats or Nasdaq, but it does offer an attractive very safe yield and superior return potential to REITs or treasury bonds
low-risk tech utility
CSCO Total Returns Since 2011 (Dividend Era)
(Source: Portfolio Visualizer Premium)
(Source: Portfolio Visualizer Premium)
CSCO’s future returns are expected to be similar to its dividend era returns of 11.3%, or 2.5X inflation-adjusted returns over the last 11 years.
What inflation-adjusted returns do analysts expect in the future?
Long-term total returns (a Ben Graham sign of quality)
Analyst consensus long-term return potential
In fact, it includes over 1,000 fundamental metrics including the 12 rating agencies we use to assess fundamental risk.
credit and risk management ratings make up 41% of the DK safety and quality model
dividend/balance sheet/risk ratings make up 82% of the DK safety and quality model
How do we know that our safety and quality model works well?
During the two worst recessions in 75 years, our safety model 87% of blue-chip dividend cuts, the ultimate baptism by fire for any dividend safety model.
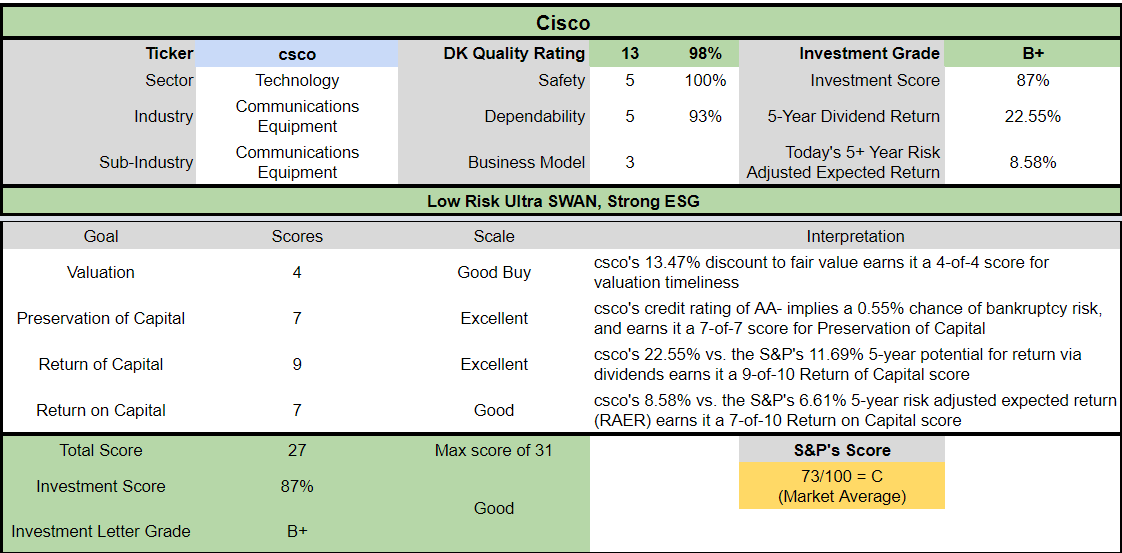
How does CSCO score on our comprehensive safety and quality models?
CSCO Dividend Safety
Rating
Dividend Kings Safety Score (162 Point Safety Model)
Approximate Dividend Cut Risk (Average Recession)
Approximate Dividend Cut Risk In Pandemic Level Recession
1 – unsafe
0% to 20%
over 4%
16+%
2- below average
21% to 40%
over 2%
8% to 16%
3 – average
41% to 60%
2%
4% to 8%
4 – safe
61% to 80%
1%
2% to 4%
5- very safe
81% to 100%
0.5%
1% to 2%
CSCO
100%
0.5%
1.0%
Risk Rating
Low-Risk (85th industry percentile risk-management consensus)
AA- Stable outlook credit rating 0.55% 30-year bankruptcy risk
20% OR LESS Max Risk Cap Recommendation
Long-Term Dependability
Company
DK Long-Term Dependability Score
Interpretation
Points
Non-Dependable Companies
21% or below
Poor Dependability
1
Low Dependability Companies
22% to 60%
Below-Average Dependability
2
S&P 500/Industry Average
61% (61% to 70% range)
Average Dependability
3
Above-Average
71% to 80%
Very Dependable
4
Very Good
81% or higher
Exceptional Dependability
5
CSCO
93%
Exceptional Dependability
5
Overall Quality
CSCO
Final Score
Rating
Safety
100%
5/5 Very Safe
Business Model
100%
3/3 Wide And Stable Moat
Dependability
93%
5/5 Exceptional
Total
98%
13/13 Ultra SWAN
Risk Rating
3/3 Low Risk
15% OR LESS Max Risk Cap Rec
10% Margin of Safety For A Potentially Good Buy
What does a 98% quality score mean?
Cisco is the 12th highest quality company on the Master List (98th percentile)
How impressive is this fact?
The DK 500 Master List includes the world’s highest quality companies including:
All dividend champions
All dividend aristocrats
All dividend kings
All global aristocrats (such as BTI, ENB, and NVS)
All 13/13 Ultra Swans (as close to perfect quality as exists on Wall Street)
49 of the world’s best growth stocks
In other words, even among the world’s best companies, CSCO is higher quality than 98% of them.
Why I Trust Cisco And So Can You
Cisco was founded in San Jose, California in 1984.
Its specialty is the hardware backbone of the internet and networks.
its routers and switching solutions are the backbones of the internet
it’s also expanding into network security
with a goal of transitioning to a hybrid hardware/subscription business model
Recurring revenue is more stable and leads to higher multiples for companies.
it’s why REITs growing 6% over time are valued at 17X cash flow
and utilities growing at 5% are worth about 18X to 20X
and even KO growing at a modest rate is worth 20X to 21X (CLX also)
We note that Cisco’s networking products are typically upgraded every three-to-seven years, and consumers typically keep the existing vendor in place as to not disturb the network. Changing network systems is a massive undertaking due to migrating existing data and infrastructure hardware to a new architecture; any network disturbance can have a tremendous cost. The more critical the application, the higher the reluctance to make a change. Most firms are inherently risk-averse to making enterprise network changes like swapping vendors, especially if the existing network has kept business operations functional. Furthermore, competitors publicly acknowledge the difficulty in taking market share from Cisco’s dominance as the incumbent solution. Pricing power is indicated by steady low- to mid-60% gross margins over the last decade even as competitors entered the market.” – Morningstar
CSCO is a very boring but beautiful business, offering good solutions to enterprise clients who are highly conservative and risk-averse.
Cisco’s shift into selling subscription-based hardware, software, and services as three-, five-, or seven-year packages have further entwined the company within its expansive customer base. New products are sold with this scheme, and Cisco is working on adopting the model to incumbent products. Data analytics and intent-based networking make Cisco stickier with the customer, since losing such valuable software capabilities can be detrimental to business results and network operations. Beyond network operation products, changing to a different security vendor can seem like a risky proposition if threats have been mitigated in the past.” – Morningstar
Cisco’s plans to become a one-stop solution provider to its clients are going well so far, with most customers trusting it after decades of solid results.
creating a relatively sticky ecosystem and wide moat
We believe that our revenue performance in the upcoming quarters is less dependent on demand and more dependent on supply availability in this increasingly complex environment. While certain aspects of the current situation are largely out of our control, our teams have been working on several mitigation actions to help alleviate many of the component issues that we’ve been facing. We believe that we will begin to see the benefits of these actions in the first half of the next fiscal year.” – CEO, fiscal Q3 conference call
Cisco is supply-constrained at the moment, with a record backlog of demand it simply can’t fill thanks to China’s lock-downs.
Recurring revenue is growing at 11%, while sales were flat.
The backlog is up 130% to a record $15 billion.
New orders grew at 8%, indicating healthy overall demand.
Subscription revenue now makes up about 44% of sales and is the fastest-growing part of the business.
New order growth ranged from 4% to 11% in all geographic regions.
CSCO’s buyback authorization stands at $17.6 billion after buying back $252 million worth of shares at an average price of $54.2 in Q3 (our Q1).
enough to buy back about 10% of shares at current valuations
Bottom Line: Cisco’s Investment Thesis Remains Intact, Steadily Growing Recurring Revenue From This Tech Utility
Now let’s take a look at the math backing up CSCO’s investment thesis.
Quantitative Analysis: The Math Backing Up The Investment Thesis
CSCO Credit Ratings
Rating Agency
Credit Rating
30-Year Default/Bankruptcy Risk
Chance of Losing 100% Of Your Investment 1 In
S&P
AA- stable
0.55%
181.8
Moody’s
A1 (A+ equivalent) Stable Outlook
0.60%
166.7
Consensus
A+ Stable Outlook
0.58%
173.9
(Source: S&P, Moody’s)
Rating agencies estimate a 0.58% fundamental risk in buying Cisco today.
1 in 174 chance of losing all your money over the next 30 years
CSCO Leverage Consensus Forecast
Year
Debt/EBITDA
Net Debt/EBITDA (3.0 Or Less Safe According To Credit Rating Agencies)
Interest Coverage (8+ Safe)
2020
0.79
-0.80
28.46
2021
0.62
-0.70
38.48
2022
0.48
-0.56
48.93
2023
0.47
-0.83
51.47
2024
0.42
-1.08
53.33
Annualized Change
-14.83%
7.67%
17.00%
(Source: FactSet Research Terminal)
CSCO has more cash than debt already and its balance sheet is expected to get slowly but steadily stronger over time.
CSCO Balance Sheet Consensus Forecast
Year
Total Debt (Millions)
Cash
Net Debt (Millions)
Interest Cost (Millions)
EBITDA (Millions)
Operating Income (Millions)
2020
$14,583
$11,809
-$14,836
$585
$18,458
$16,650
2021
$11,526
$9,175
-$12,992
$434
$18,564
$16,702
2022
$9,418
$13,550
-$10,892
$354
$19,558
$17,320
2023
$9,085
$20,746
-$16,264
$350
$19,483
$18,014
2024
$8,501
$22,254
-$22,088
$360
$20,445
$19,200
2025
$8,221
$20,639
NA
NA
NA
$21,346
Annualized Growth
-10.83%
11.81%
10.46%
-11.43%
2.59%
5.09%
(Source: FactSet Research Terminal)
Debt is falling at double digits, while cash is growing at double digits and cash flows are growing at a modest pace.
well-staggered bond maturities, no trouble refinancing maturing debt
3.45% average borrowing cost vs bond market’s 2.55% long-term inflation forecast
CSCO’s effective real interest rate is 0.9% vs 26.3% return on invested capital
CSCO Credit Default SWAP Spreads: Bond Market’s Real-Time Fundamental Risk Assessment
(Source: FactSet Research Terminal)
Credit default swaps are insurance against bond defaults, and thus represent a real-time bond market estimate of a company’s short and medium-term bankruptcy risk.
CSCO’s CDS indicating fundamental risk has soared in recent months.
Mainly after China’s lockdowns began.
1-year bankruptcy risk has doubled to 0.13%.
10-year risk is up 36% in the last 6 months to a still-low 0.58%
the bond market is pricing in 1.74% 30-year bankruptcy risk which is consistent with an A- positive outlook credit rating
The bond market is basically agreeing with rating agencies and analysts that CSCO’s investment thesis remains intact.
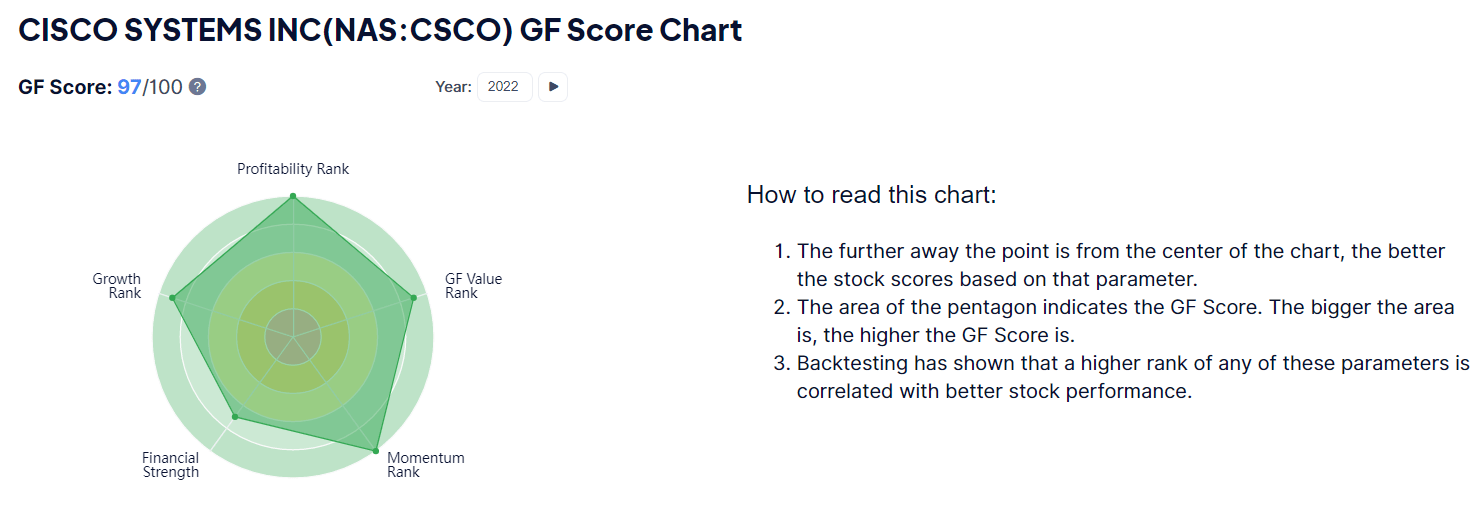
CSCO GF Score: The Newest Addition To The DK Safety And Quality Model
The GF Score is a ranking system that has been found to be closely correlated to the long-term performances of stocks by backtesting from 2006 to 2021.” – Gurufocus
GF Score takes five key aspects into consideration. They are:
Financial Strength
Profitability
Growth
Valuation
Momentum
(Source: Gurufocus Premium)
CSCO’s exceptionally strong 97/100 GF score confirms its excellent fundamentals as well as attractive valuation.
An industry leader in financial strength, profitability, growth, and valuation.
CSCO’s profitability is historically within the top 10% of its peers.
CSCO Trailing 12-Month Profitability Vs Peers
Metric
Industry Percentile
Major Tech Hardware Makers More Profitable Than CSCO (Out Of 2,390)
Gross Margins
94.76
125
Operating Margin
96.54
83
Net Margin
94.90
122
Return On Equity
94.22
138
Return On Assets
90.21
234
Returns On Invested Capital
76.74
556
Return On Capital
99.50
12
Return On Capital Employed
86.89
313
Average
91.29
208
(Source: Gurufocus Premium)
Profitability in the last year has been in the top 9% of its peers.
CSCO’s profitability is relatively stable over the last 30 years, confirming its wide and stable moat.
FCF margins of 30% are in the top 10% of all companies on earth
CSCO Margin Consensus Forecast
Year
FCF Margin
EBITDA Margin
EBIT (Operating) Margin
Net Margin
Return On Capital Expansion
Return On Capital Forecast
2020
29.7%
37.4%
33.8%
27.7%
1.04
2021
29.6%
37.3%
33.5%
27.4%
TTM ROC
681.15%
2022
25.6%
38.1%
33.8%
27.4%
Latest ROC
743.62%
2023
29.1%
36.6%
33.9%
27.7%
2025 ROC
709.88%
2024
30.5%
36.6%
34.4%
28.1%
2025 ROC
774.99%
2025
34.3%
NA
34.9%
29.3%
Average
742.43%
2026
NA
NA
NA
NA
Industry Median
13.53%
2027
NA
NA
NA
NA
CSCO/Industry Median
54.87
Annualized Growth
2.92%
-0.58%
0.68%
1.14%
Vs S&P
50.85
Annualized Growth (Ignoring Pandemic)
3.75%
-0.62%
1.04%
1.74%
(Source: FactSet Research Terminal)
CSCO’s margins are expected to remain stable or improve slowly over time, up to 34% FCF margins in 2025.
Return on capital is pre-tax profit/operating capital (the money it takes to run the business).
Joel Greenblatt’s gold standard proxy for quality and moatiness
Analysts are expecting ROC to increase modestly by 2025 to 742%.
and achieve almost 55X the industry norm
and more than 51X the S&P 500
CSCO’s ROC Has Been Rising For Over 25 Years
CSCO’s ROC has been rising as its transitions to a software-focused recurring revenue business model.
700% to 800% ROC that’s trending higher for decades is a confirmation of a wide and stable moat.
and one of the highest quality companies on earth
Reason Three: Decent Growth Outlook For Decades To Come
Cisco’s growth is tied to the growth of the internet, specifically cloud computing.
a potential $10 trillion annual industry by 2035
CSCO Growth Spending Consensus Forecast
Year
SG&A (Selling, General, Administrative)
R&D
Capex
Total Growth Spending
Sales
Growth Spending/Sales
2020
$9,483
$5,572
$770
$15,825
$49,301
32.10%
2021
$10,588
$5,624
$692
$16,904
$49,818
33.93%
2022
$10,256
$5,749
$510
$16,515
$51,309
32.19%
2023
$10,515
$5,845
$625
$16,985
$53,163
31.95%
2024
$11,207
$6,077
$696
$17,980
$55,895
32.17%
2025
$12,576
$6,582
$528
$19,686
$61,093
32.22%
Annualized Growth
5.81%
3.39%
-7.27%
4.46%
4.38%
0.08%
Total Spending 2022 To 2025
$44,554
$24,253
$2,359
$71,166
$221,460
NA
(Source: FactSet Research Terminal)
CSCO is a capex light business and mature company.
Growth spending is now growing in line with sales, representing about 32% of revenue.
Total growth spending over the next four years is expected to be about $72 billion including $24 billion on R&D.
CSCO Medium-Term Growth Consensus Forecast
Year
Sales
Free Cash Flow
EBITDA
EBIT (Operating Income)
Net Income
2020
$49,301
$14,656
$18,458
$16,650
$13,658
2021
$49,818
$14,762
$18,564
$16,702
$13,636
2022
$51,309
$13,114
$19,558
$17,320
$14,075
2023
$53,163
$15,493
$19,483
$18,014
$14,711
2024
$55,895
$17,060
$20,445
$19,200
$15,717
2025
$61,093
$20,972
NA
$21,346
$17,915
Annualized Growth
4.38%
7.43%
2.59%
5.09%
5.58%
Annualized Growth (Ignoring Pandemic)
5.23%
9.18%
3.27%
6.33%
7.06%
Cumulative Over The Next 6 Years
$221,460
$66,639
$59,486
$75,880
$62,418
(Source: FactSet Research Terminal)
CSCO is a modestly growing business, generating 5% sales growth outside of the pandemic.
The bottom line is growing slightly faster at 7% for net income and 9% for free cash flow.
CSCO Dividend Growth/Buy Back Potential Consensus Forecast
Year
Dividend Consensus
FCF/Share Consensus
FCF Payout Ratio
Retained (Post-Dividend) Free Cash Flow
Buyback Potential
Debt Repayment Potential
2021
$1.46
$3.50
41.7%
$8,474
4.71%
73.5%
2022
$1.50
$3.03
49.5%
$6,356
3.53%
67.5%
2023
$1.54
$3.72
41.4%
$9,056
5.03%
96.2%
2024
$1.59
$3.80
41.8%
$9,180
5.10%
101.0%
Total 2022 Through 2024
$4.63
$10.55
43.9%
$33,065.84
18.36%
351.09%
Annualized Rate
2.88%
2.78%
0.10%
2.70%
2.70%
11.18%
(Source: FactSet Research Terminal)
CSCO’s dividend growth isn’t expected to be that impressive, merely a 3% annual growth that the bond market expects to keep up with inflation.
But at a 44% average consensus FCF payout ratio it’s a very safe dividend.
rating agencies consider 60% FCF payout ratios safe for this industry
CSCO is expected to retain $33 billion in post-dividend free cash flow in the next three years, enough to pay off its debt by 3.5X or buy back up to 18% of its shares at current valuations.
CSCO Buy Back Consensus Forecast
Year
Consensus Buybacks ($ Millions)
% Of Shares (At Current Valuations)
Market Cap
2022
$6,284.0
3.5%
$180,083
2023
$2,750.0
1.5%
$180,083
2024
$4,000.0
2.2%
$180,083
2025
$3,000.0
1.7%
$180,083
Total 2022-2023
$16,034.00
8.9%
$180,083
Annualized Rate
2.30%
Average Annual Buybacks
$4,008.50
(Source: FactSet Research Terminal)
Analysts expect CSCO to front-load its $16 billion in buybacks through 2025 in 2022.
prudent in a bear market
At current valuations, analysts think CSCO could buy back 2.3% of shares each year.
Since CSCO began steady buybacks in 2002, it’s averaged a net repurchase rate of 2.8% per year.
44% of stock repurchases over the last two decades
Time Frame (Years)
Net Buyback Rate
Shares Remaining
Net Shares Repurchased
Each Share You Own Is Worth X Times More (Not Including Future Growth And Dividends)
5
2.3%
89.02%
10.98%
1.12
10
2.3%
79.24%
20.76%
1.26
15
2.3%
70.54%
29.46%
1.42
20
2.3%
62.79%
37.21%
1.59
25
2.3%
55.89%
44.11%
1.79
30
2.3%
49.76%
50.24%
2.01
(Source: FactSet Research Terminal)
At the consensus buyback rate, CSCO could buy back 50% of its stock within the next 30 years.
doubling the value of your shares’ intrinsic value
ignoring future dividend and earnings growth
and inflation
CSCO Long-Term Growth Outlook
(Source: FactSet Research Terminal)
20-year growth rate: 10.9% CAGR
consensus growth range (5 sources): 5.4% to 7.1% CAGR
median growth consensus from all analysts: 7.1% CAGR
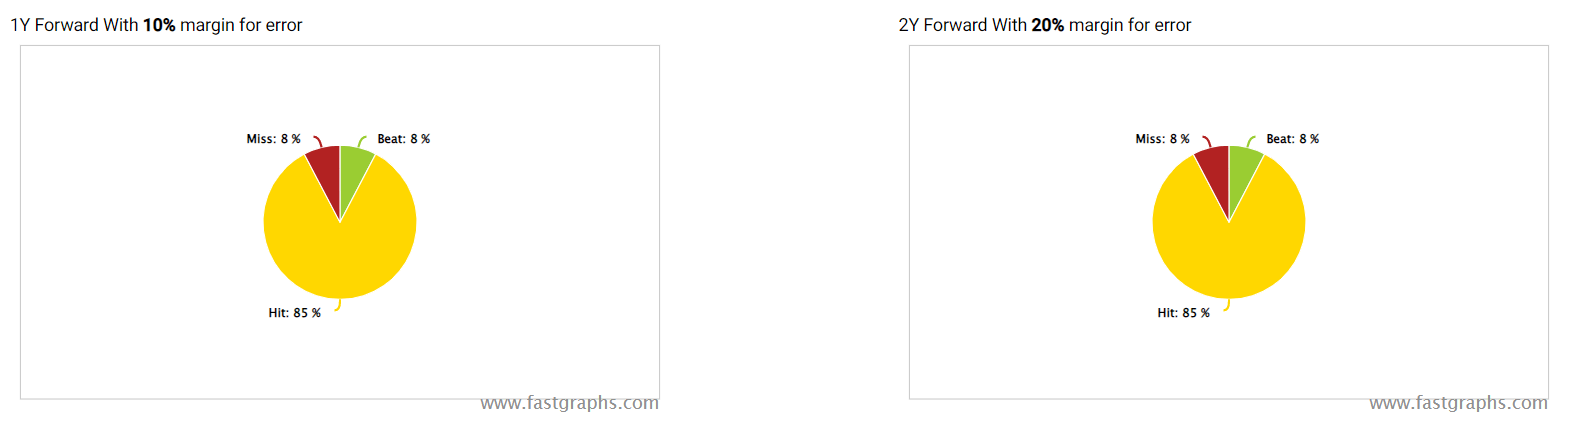
How accurate are analysts at forecasting CSCO’s growth over time?
FAST Graphs, FactSet
FAST Graphs, FactSet
Smoothing for outliers analyst margins of error are 5% to the downside and 5% to the upside.
4% to 8% CAGR historical margin of error adjusted growth consensus range
70% statistical probability CSCO grows at 4% to 8% over time
CSCO’s historical growth rates over the last 20 years ranged from 0% to 11% and analysts expect future growth to be similar to the last 14 years.
Reason Four: A Wonderful Company At An Attractive Price
Ignoring the tech bubble, CSCO’s market-determined fair value is 13.5X to 14.5X, slightly towards the highest end of that range.
Metric
Historical Fair Value Multiples (12-years)
2021
2022
2023
2024
12-Month Forward Fair Value
5-Year Average Yield
2.97%
$49.83
$51.18
$51.18
$52.53
Earnings
14.00
$45.92
$48.16
$50.96
$55.44
Average
$47.80
$49.62
$51.07
$53.94
$50.18
Current Price
$43.35
Discount To Fair Value
9.30%
12.64%
15.11%
19.64%
13.61%
Upside To Fair Value (NOT Including Dividends)
10.26%
14.47%
17.81%
24.44%
15.75% (19% including dividend)
2022 EPS
2023 EPS
2022 Weighted EPS
2023 Weighted EPS
12-Month Forward EPS
12-Month Average Fair Value Forward PE
Current Forward PE
$3.44
$3.64
$2.12
$1.40
$3.52
14.3
12.3
I estimate CSCO is worth about 14.3X earnings and today it trades at 12.3X.
8.8X cash-adjusted earnings
Analyst Median 12-Month Price Target
Morningstar Fair Value Estimate
$52.90 (15.0 PE)
$54.00 (15.4)
Discount To Price Target (Not A Fair Value Estimate)
Discount To Fair Value
18.05%
19.72%
Upside To Price Target (Not Including Dividend)
Upside To Fair Value (Not Including Dividend)
22.03%
24.57%
12-Month Median Total Return Price (Including Dividend)
Fair Value + 12-Month Dividend
$54.42
$55.52
Discount To Total Price Target (Not A Fair Value Estimate)
Discount To Fair Value + 12-Month Dividend
20.34%
21.92%
Upside To Price Target ( Including Dividend)
Upside To Fair Value + Dividend
24.72%
28.07%
Morningstar’s DCF model estimates CSCO to be worth 15.4X earnings (not unreasonable but slightly high by historical standards).
Analysts expect it to trade at 15X in 12 months, generating 25% total returns.
I don’t care about 12-month price forecasts, just whether or not the current market of safety sufficiently compensates you for the risk profile.
Rating
Margin Of Safety For Low-Risk 13/13 Ultra SWAN quality companies
2022 Price
2023 Price
12-Month Forward Fair Value
Potentially Reasonable Buy
0%
$49.62
$51.07
$50.18
Potentially Good Buy
5%
$47.14
$48.52
$47.67
Potentially Strong Buy
15%
$42.18
$43.41
$42.65
Potentially Very Strong Buy
25%
$35.36
$38.30
$37.63
Potentially Ultra-Value Buy
35%
$32.26
$33.19
$32.62
Currently
$43.35
12.64%
15.11%
13.61%
Upside To Fair Value (Not Including Dividends)
14.47%
17.81%
15.75%
For anyone comfortable with its risk profile CSCO is a potentially good buy and about 2% away from becoming a potentially strong buy.
Risk Profile: Why Cisco Isn’t Right For Everyone
There are no risk-free companies and no company is right for everyone. You have to be comfortable with the fundamental risk profile.
What Could Cause CSCO’s Investment Thesis To Break
safety falls to 40% or less
balance sheet collapses (highly unlikely, 0.55% probability according to S&P)
loses significant market share to rivals such as Paulo Alto Networks
failure of recurring revenue business model transition plan
growth outlook falls to less than 5.5% for seven years
CSCO’s role in my portfolio is to deliver long-term 8+% returns with minimal fundamental risk (I treat it as a defensive tech utility)
How long it takes for a company’s investment thesis to break depends on the quality of the company.
Quality
Years For The Thesis To Break Entirely
Below-Average
1
Average
2
Above-Average
3
Blue-Chip
4
SWAN
5
Super SWAN
6
Ultra SWAN
7
100% Quality Companies (MSFT, LOW, and MA)
8
These are my personal rule of thumb for when to sell a stock if the investment thesis has broken.
CSCO is highly unlikely to suffer such catastrophic declines in fundamentals.
CSCO’s Risk Profile Includes
inherent cyclicality of the tech hardware industry (falling with recurring revenue transition)
disruption risk (commodity white box solutions are a threat to its high margin business)
M&A execution risk (CSCO does a lot of small bolt-on acquisitions)
labor retention risk (tightest job market in over 50 years and finance is a high paying industry)
cybersecurity risk: hackers and ransomware
currency risk: 48% of sales are from outside the US
How do we quantify, monitor, and track such a complex risk profile? By doing what big institutions do.
Long-Term Risk Analysis: How Large Institutions Measure Total Risk
see the risk section of this video to get an in-depth view (and link to two reports) of how DK and big institutions measure long-term risk management by companies
CSCO Long-Term Risk Management Consensus
Rating Agency
Industry Percentile
Rating Agency Classification
MSCI 37 Metric Model
98.0%
AA, Industry Leader, Positive Trend
Morningstar/Sustainalytics 20 Metric Model
87.1%
12.1/100 Low-Risk
Reuters’/Refinitiv 500+ Metric Model
98.4%
Excellent
S&P 1,000+ Metric Model
78.0%
Good, Stable Trend
Just Capital 19 Metric Model
90.5%
Excellent
FactSet
30.0%
Below-Average, Positive Trend
Morningstar Global Percentile (All 15,000 Rated Companies)
96.5%
Exceptional
Just Capital Global Percentile (All 954 Rated US Companies)
The bottom line is that all companies have risks, and CSCO is very good at managing theirs.
How We Monitor CSCO’s Risk Profile
29 analysts
2 credit rating agencies
7 total risk rating agencies
36 experts who collectively know this business better than anyone other than management
and the bond market for real-time fundamental risk assessments
When the facts change, I change my mind. What do you do sir?” – John Maynard Keynes
There are no sacred cows at iREIT or Dividend Kings. Wherever the fundamentals lead we always follow. That’s the essence of disciplined financial science, the math behind retiring rich and staying rich in retirement.
Bottom line: It’s Finally Time To Buy This High-Yield Tech Utility
I’m not a market timer and I’m NOT saying that CSCO is done falling.
No one knows when the market will finally bottom, or if it already has.
Time Frame
Historically Average Bear Market Bottom
Non-Recessionary Bear Markets Since 1965
-21%
Median Recessionary Bear Market Since WWII
-24%
Non-Recessionary Bear Markets Since 1928
-26%
Bear Markets Since WWII
-30%
Recessionary Bear Markets Since 1965
-36%
All 140 Bear Markets Since 1792
-37%
Average Recessionary Bear Market Since 1928
-40%
(Sources: Ben Carlson, Bank of America, Oxford Economics, Goldman Sachs)
If we avoid recession then we might have already bottomed.
If we don’t avoid recession (75% of Fortune 500 CEOs expect a mild recession next year) then we might have a bit more to drop.
If inflation comes down faster than expected, then the Fed has a decent shot at a soft landing.
If inflation stays high then the Fed might have to hike to 4% or even more (Deutsche Bank thinks the Fed will go to 5% to 6%).
Nobody can predict interest rates, the future direction of the economy, or the stock market. Dismiss all such forecasts and concentrate on what’s actually happening to the companies in which you’ve invested.” – Peter Lynch
But here’s what I can tell you with very high confidence.
No matter what happens with inflation, interest rates, or the economy in 2022 and beyond, Cisco will endure and likely thrive.
This AA-rated company has $14 billion more cash than debt and is generating $14 billion in free cash flow per year.
44% of sales are now recurring revenue, making this tech utility business model relatively recession-resistant.
Cisco suffered a setback in Q1, thanks to supply chain disruptions in China.
But Cisco’s demand remains strong, and supply is the issue, not future growth prospects.
Cisco isn’t an exciting business, but it’s a boring and beautiful one.
It’s not a risk-free company, those don’t exist. But it’s risk management is the stuff of legend, in the top 15% of its peers and in the top 4% of the world’s greatest companies.
Cisco isn’t a hyper-growth tech legend, and it’s not going to make you ungodly rich in the coming decades.
But it can potentially deliver market-beating 13% annual returns over the next three to five years, 50% more than the S&P consensus.
And at just 8.5X cash-adjusted earnings, CSCO is 14% historically undervalued, representing a classic Buffett-style “wonderful company at a fair price”.
In fact, for an Ultra SWAN company like this, I consider CSCO’s current valuation a wonderful price, making it a potentially good buy and not far from a strong buy.
If you are looking for a very safe 3.5% yield you can rely on to grow every year, no matter what the economy does, consider Cisco.
If you want to earn double-digit returns in the medium and long-term with very low (0.55%) fundamental risk, consider Cisco.
If you’re looking to make your own luck on Wall Street, then Cisco is a reasonable and prudent choice.
In a world of high uncertainty and peak fear, there is a lot to love about one of the greatest dividend stocks on earth.
The UK introduced a 25% windfall oil and gas tax. Prime Minister Boris Johnson’s Conservative government became the first to put into action an argument that the energy industry has profited too much from a surge in commodity prices that are stoking inflation. About 5 billion pounds is expected to be raised, which will finance a one-time payment of 650 pounds to about 8M of the poorest households.
Statements: “The oil and gas sector is making extraordinary profits,” Chancellor of the Exchequer Rishi Sunak said in Parliament. “Not as the result of recent changes to risk taking or innovation or efficiency, but as the result of surging global commodity prices.”
The tax “sends the wrong signal to the whole sector, against a backdrop of rising business taxation elsewhere,” Rain Newton-Smith, chief economist at the Confederation of British Industry, told the BBC.
How it works: Details of the final legislation remain vague. There will be a sunset clause; however, the clause will be price dependent, with no specified date. There will be an investment tax incentive; however, the incentive appears lower than existing incentives. And there may or may not be a “baseline” profitability measure which determines the quantum of the “windfall” profits. Furthermore, investors are left guessing at exactly who will pay the tax.
The UK has a somewhat complicated tax and royalty regime for North Sea producers. All UK resident companies pay corporate income tax on worldwide pre-tax profits. If BP (BP) earns a profit refining oil in Whiting Indiana, it will pay tax on those profits to the UK Treasury. However, the UK also charges North Sea producers a “ring fence” corporate tax, a “supplementary charge”, a “petroleum revenue tax” and a “value added tax.” Deloitte estimates the effective “government take” on pre-tax profits for UK North Sea producers at between 62% and 81%.
And although the Chancellor did not specify who will pay the incremental 25% tax, it’s likely to be imposed on UK producers, rather than UK-domiciled entities alone. That is to say, BP (BP) is unlikely to be charged a windfall tax on profits earned in Indiana, but Total (TTE) will bear the higher rates on UK North Sea production.
Start of a trend? Could the UK’s decision spur movements in other countries for similar taxes? The Wall Street Journal described the decision as “Boris Johnson Goes Bernie Sanders.” Undoubtedly, proponents of windfall taxes will point to a right-wing government embracing such policies as a starting point.
President Joe Biden has called for eliminating tax breaks for oil and fossil fuel companies, but a windfall tax seems remote. While it is a literal Conservative Party, the UK Parliamentary majority has a track record of tax moves that U.S. Republicans would consider as extremely left-wing. In 2011 Tory Chancellor George Osborne put a “supplementary charge” on oil and gas production to the tune of 2 billion pounds.
Energy tax increases “would disincentivize additional production, decrease supply, and subsequently increase energy costs for families at a time of historic inflation and record-high gasoline prices,” Anne Bradbury, CEO of the American Exploration and Production Council, told the Houston Chronicle. “For these reasons, members of both parties have consistently rejected attempts to target energy producers with new taxes and fees.” (90 comments)
Jumia Nigeria, Africa’s leading e-commerce platform, held a vendors’ conference over the weekend at Eko Hotel & Suites, Victoria Island, Lagos, in preparation for its 10th-Anniversary Sale, which officially begins on June 14th – July 3rd.
This was the company’s first physical event after COVID, and it featured vendors on its platform as well as Jumia Nigeria’s top management. The teams shared insights, plans, and strategies for the upcoming 10-year sales campaign, as well as other effective ways to improve the overall business.
Jumia has committed to using a variety of marketing strategies to raise awareness of the anniversary sale, including billboards, radio, influencers, social media campaigns, and games. During the presentations, vendors were encouraged to use the Jumia Express service to provide free delivery to customers during the sale. There were also calls to use Jumia Advertising to increase store visibility, Jumia Logistics for convenient delivery across Nigeria, and JumiaPay for secure and seamless payments. The highlight of the event was when the Jumia anniversary video was played, much to the delight of the vendors, who were eager to have it downloaded to their phones.
This is a special occasion for all of us because it marks ten years of e-commerce in Nigeria. Over the last decade, Jumia has collaborated with forward-thinking businesses and brands to make an impact across key value chains, providing consumers with convenience and better shopping experiences. Furthermore, we have created numerous opportunities for SMEs to grow, which has benefited the economy. “We are thrilled to be celebrating ten years with our vendors, who have enabled us to provide the best shopping experience to consumers across Nigeria,” said Jumia Nigeria CEO Massimiliano Spalazzi.
Participating vendors will be able to sell their products and grow their businesses to millions of consumers on the Jumia platform.
“I am thrilled to be a part of Jumia’s 10-year anniversary sale.” They would benefit both vendors and sellers. I must thank Jumia for assisting SMEs like mine in growing and reaching more consumers. “I started my business on the platform over 5 years ago from nothing to being one of the top phone vendors,” Abdul-Hafeez Olayinka, Owner of Bafur Store, said.
Samsung, Coca-Cola, Adidas, Oraimo, Nivea, Diageo, Xiaomi, Itel, Unilever, Nestle, Apple, Anker, Nokia, Pernod Ricard, Reckitt Benckiser, Binatone, TCL, and other top brands will be featured in Jumia’s 10th anniversary sale.
Inflation is running hot, there is a great deal of speculation in the markets, and it is a real possibility the Fed waited way too long to raise rates. After announcing late last year, plans to taper asset purchases and tighten monetary policy, the Fed continued buying billions in bonds and assets through March 2022. If the Fed knew it needed to tighten, why were they easing and continuing to purchase assets? This created a lot of uncertainty in the markets.
An exorbitant amount of liquidity has distorted asset prices and risk, hence a balance sheet just under $9T. As Seeking Alpha Contributor Goldmoney writes in Too Much Liquidity:
The Fed sees that there is too much unused liquidity. And making the situation worse, instead of raising money through bond sales, the US Treasury has been drawing down on its balance at the General Account with the Fed – technically putting money into circulation which was not there before.
Keeping the interest rates at zero while continuing to pump stimulus and cash at no cost into the economy inflates asset prices. It’s equivalent to pumping steroids into the free markets. Not only is the excess cash causing asset prices and cost of goods sold (COGS) to run rampant as demand outpaces supply, pumping fiscal stimulus into people’s pockets through Q1 of 2022 exasperates supply-demand issues, perpetuating higher inflation, making it appear that everything the Fed has done post-financial crisis intends to eradicate growth and suffocate both the economy and markets.
The tighter monetary policy is already impacting the economy, the fixed-income markets, and the equity markets. The economy is slowing, which we saw with the first-quarter contraction in GDP, a dramatic drop in new home sales by almost 17% in April, and many companies complaining about margins. The Fed still wants to raise rates by 200-300 basis points before year-end while simultaneously reducing its balance sheet. The running joke is that inflation wasn’t transitory, as Fed Chair Powell claimed, which is now apparent and a problem that requires the Fed to thread the needle for a soft landing to avoid a recession. The burning question among investors and the markets is how much will the Fed raise interest rates? With anticipation mounting and rumors of an aggressive increase of 3 percentage points by year-end, which are the best stocks to buy now during rising interest rates?
Profiting During Interest Rate Hikes
In a 2021 article titled Inflation-Proof Your Portfolio: These 3 Energy Stocks Are Very Bullish, I warned investors about inflation as signs were clear it was bubbling up. Some sectors and industries are better suited for inflation and benefit from rising interest rates. Notably, certain financial stocks can benefit from rising interest rates because of net interest income, increasing margins, and lending at higher rates. By example, insurance companies benefit from higher-yielding investments that bode well for their margins and premium baskets. They can also easily pass along their cost to the end customer. Additionally, energy and commodities have proven to benefit and pass along cost, with prices remaining at all-time highs.
If you’re considering stocks at a reasonable price with solid growth, profitability, and good momentum, we have three top stocks for Fed rate hikes that fit the bill. Energy stocks can easily pass along costs. They can also offer stable dividend yields and strong cash flow. A steady stream of income in this inflationary environment is what investors are looking for.
Chevron Corporation (CVX) has rebounded significantly from pandemic lows, trading at all-time highs. It is rallying as a Top Energy Stock, aided by the recent news of the company’s renewal of its Venezuelan license. Chevron is a diversified growth stock, operating upstream, midstream, and downstream segments. CVX not only has an excellent track record and solid fundamentals, but it also has the strong possibility to climb further on the back of rising fuel costs and continued “pain at the pump”, making this integrated oil giant great for portfolios and an inflation hedge. I think Warren Buffett agrees, given the additional shares of CVX purchased for his company Berkshire, making Chevron the 4th largest equity holding at $25.9B.
Chevron Valuation
Although Chevron possesses a D+ valuation which is not ideal, a number of its underlying valuation metrics are in line with its peer Exxon Mobil (XOM), including the all-important forward P/E ratio of 10.43x, and both forward EV/Sales and EV/EBITDA command Seeking Alpha B- grades on these underlying valuation metrics. Chevron’s other factor grades are great, and while CVX may not be trading at investors’ preferred discounts, we focus on stocks’ collective attributes.
CVX Factor Grades (Seeking Alpha Premium)
The growth, profitability, momentum, and revisions grades above are attractive. Wall Street is pretty keen on the stock as well. Twenty-four analysts revised their revisions up within 90 days, and there have been zero down revisions. Let’s dive into CVX’s profitability, and growth and the tremendous Q1 results showcased below.
Large energy companies tend to have the most liquid stocks, best profitability, and the means to pay handsome dividends. Even during market volatility, commodities can be rewarding for protection and profit in an inflationary environment, posing great opportunities amid Fed rate hikes, and why the energy sector is a way to Inflation-Proof A Portfolio. With A+ Cash from Operations sitting at $33.05B and B- EBIT Margins (TTM), ongoing global conflicts continue to drive oil and gas prices, creating a great moat for CVX.
CVX Profitability (Seeking Alpha Premium)
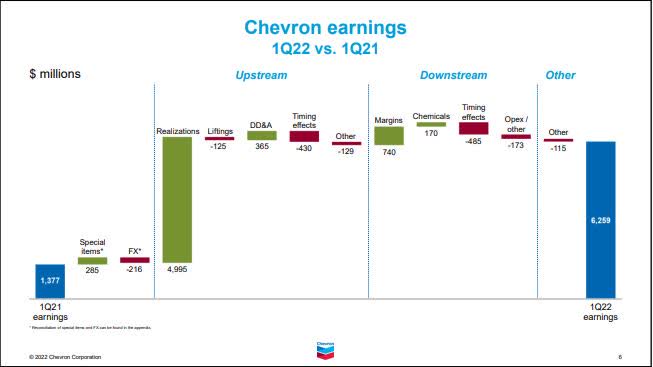
Despite Chevron’s Q1 2022 EPS of $3.36 missing by $0.08, revenues increased by nearly 70%. Chevron adjusted Q1 Earnings were up $4.8B compared to the same period last year, primarily on higher Upstream realizations. Downstream increased due to higher margins. CVX has an excellent balance sheet, which translates into the company’s 34 years of consecutive dividend payments.
We generate more free cash flow than we ever have in the past. And that means we’re able to grow the dividend at very competitive rates and have this buyback that we can maintain across the cycle…We grew our dividend 6% earlier this year. Our dividend is up nearly 20% since COVID, while many in the industry cut their dividends during the last couple of years. Our investment — organic investment is up more than 30% versus last year…With higher commodity prices, affiliate dividends are expected to be $1 billion higher than our previous guidance. – Pierre Breber, Chevron VP & CFO.
CVX Dividend Grades (Seeking Alpha Premium)
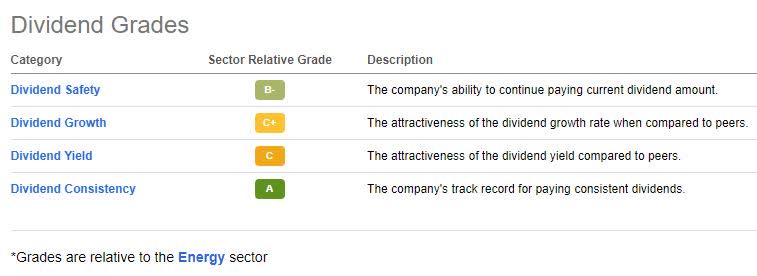
Chevron has a great dividend track record and a strong 3.31% forward dividend yield. As one of the biggest names in oil and gas, Chevron has a consistent track record of supplementing the income being eaten away in this inflationary environment. Given its significant position in the Permian Basin, expansion projects in Kazakhstan, and potential discoveries in Mexico and Brazil, Chevron’s runway looks excellent, with expected free cash flow to increase. We expect Chevron to deliver high returns going forward, expanding margins by capitalizing on high commodity prices, even amid fed rate hikes.
The Mosaic Company (MOS), through its subsidiaries, markets potash, a potassium-rich salt mined from seabeds used in fertilizers to support crop yields and enhance water preservation and phosphate nutrients globally. Fertilizer companies are shattering records to keep up with demand, and Mosaic is a top fertilizer stock to watch. This is a great stock pick for Fed rate hikes because it’s virtually inflation-proof, encompassing food – staples – necessities. As sanctions persist throughout Europe, potash and nitrogen-producing companies like MOS are capitalizing.
Mosaic Valuation
Mosaic comes at a fair valuation and a relative discount to its peers, trading under $60 per share. Although the stock’s valuation grade is a C, MOS’s forward P/E of 4.26x is at a 64% discount to its sector peers. MOS has forward EV/Sales of 1.13x, a -26% difference to the sector, indicating that it is relatively undervalued. This stock is priced well at the current price point and its upward trend over several quarters.
MOS Valuation Grade (Seeking Alpha Premium)
On May 18, following news of the U.S. backing the UN’s plan to facilitate grain and fertilizer exports from Russia, Ukraine, and Belarus, fertilizer and grain stocks experienced a slide in prices greater than the broader market. Despite this slide, companies like Mosaic continue to benefit from the conflicts and disrupted exports in Europe, given the need for grain and merchandising. With China recently extending export restrictions, producers like Mosaic should see more significant gains, solidifying its strong buy rating.
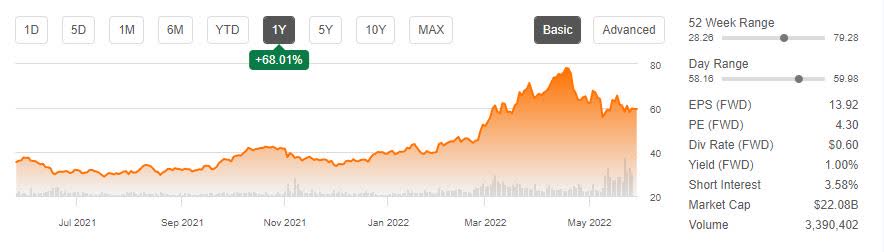
As you can see from the chart above, MOS has experienced tremendous success over the last year. In reviewing its share price activity and extremely bullish momentum, MOS’s price performance has outperformed the sector median 6x over six months and 22x over nine months, with no slowing in sight.
MOS Momentum Grade (Seeking Alpha Premium)
As we look at Mosaic’s excellent runway and A+ momentum grade, the stock is one of the tops in its sector and industry, consistently outperforming peers on quarterly price performance. As we look to the future of MOS, consider its incredible growth and profitability.
Mosaic Growth & Profitability
Agricultural prices are at multi-year highs with no shortage of need for grains and fertilizers to meet demand. Mosaic focuses on increasing production as the global grain market and exporters face uncertainty amid continued conflicts in Russia and Ukraine. Their collective exports of corn, wheat, and barley have averaged approximately 50 million metric tons per year since 2017.
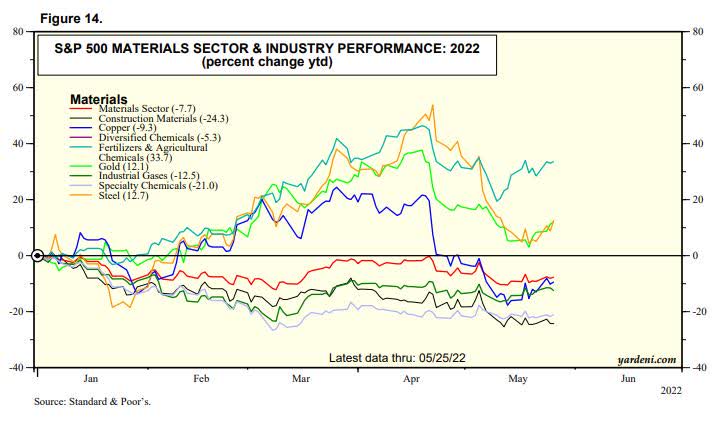
Commodities and fertilizer stocks like MOS have been the benefactors of the conflict abroad and have been significant at inflation-proofing. The chart below shows that fertilizers and agricultural chemicals are up more than 28%.
S&P 500 Materials Sector & Industry Performance: 2022 (Yardeni/S&P)
Mosaic is a top-five potash producer, and as fertilizer prices skyrocket and have taken steps to be more operationally efficient, benefitting from its cost position, ramping up production at its new K3 mine at Esterhazy, and vertically integrating phosphate assets. As the world’s largest phosphate producer, Mosaic mines its own phosphate rock, a crucial feedstock component used to produce such fertilizers. Given year-over-year inflation increases and CPI at 8.3% in April, even if food inflation experiences slowing in the upcoming months, the annual rate for 2022 will be the highest since 2008, translating into some of the sector’s most significant gains.
MOS Growth Grade (Seeking Alpha Premium)
Despite a slight EPS miss in Q1 of $2.41 by $0.01 and revenue of $3.92B, missing by $125M, strong pricing in the sector allowed MOS to offset input costs, and we cannot emphasize enough the increased need for crop nutrients and no slowing in demand. According to SA News, MOS was short of estimates due to logistical constraints that the company said are expected to improve, but linger a little while longer into Q2. Mosaic possesses an A growth grade and A- profitability grade, with year-over-year revenue growth of 52.30%, compared to 26.35% for the sector.
Phosphate segment adjusted EBITDA totaled $632 million, reflecting the impact of strong pricing, which more than offset higher input costs. Potash also benefited from higher prices, as well as the transition to Esterhazy K3, and the elimination of brine inflow management costs. As a result, segment adjusted EBITDA totaled $651 million…Looking forward, we continue to see agricultural market strength extending well beyond 2022,” said Joc O’Rourke, Mosaic President & CEO.
Fertilizers and agricultural chemicals are at the forefront of top stocks and rising prices. Food shortages are sweeping the globe, so there’s time to get in on the action if you missed out on buying this stock when it was trading at an extreme discount. While Mosaic still comes at a fair valuation, as inflation leaves its mark, MOS is a company that will pass costs onto consumers while increasing its profits, making it an attractive stock for portfolios. In my opinion, the pullback from its April high presents a terrific buying opportunity.
A global leader in the insurance industry with more than an $80B market cap, Chubb Limited provides insurance and reinsurance products worldwide. As a result of inflation, better pricing, and industry conditions acting as tailwinds, Chubb experienced great Q1 results, increasing cash flows and an excellent dividend.
Chubb Valuation
Chubb’s written global property and casualty (P&C) premiums increased 11%. Although the company’s D valuation grade is not ideal, we believe the stock is still worth consideration, given its consistent earnings in underwriting profits and global penetration.
CB Factor Grades (Seeking Alpha Premium)
Despite a number of valuation metrics with D grades, the all-important PEG ratio looks good. This ratio combines P/E with growth. Chubb possesses a forward PEG ratio of 0.75x compared to the sector at 1.13, a 33% difference to the sector, earning a Seeking Alpha Quant B+ grade for this all-important multiple. While this stock’s overall valuation grade indicates it is somewhat overvalued, we still see great potential, given attractive growth, profitability, momentum, and revisions grades showcased in the above factor grades.
CB Profitability and Growth
Chubb is on a longer-term upward trend, outperforming the S&P 500 by more than 24% over the last year. As a large insurer, primarily in P&C insurance, this company benefits from substantial growth opportunities and has consecutively beat earnings estimates. Attractive on growth and possessing stellar profitability grades, Chubb is one of the few insurance companies with a global footprint and an influential book of corporate insurance customers, creating a barrier for other insurers, thus decreasing its competition.
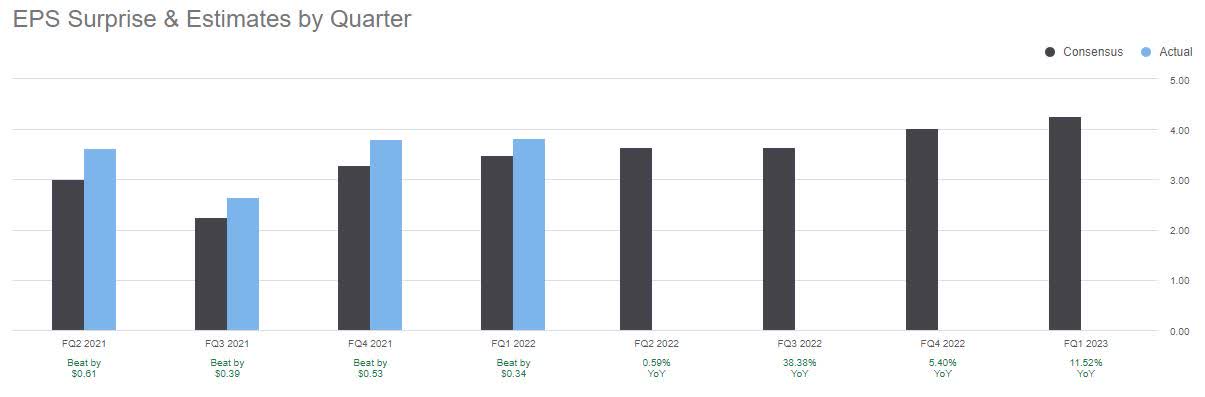
CB Earnings (Seeking Alpha Premium)
Q1 2022 earnings resulted in an EPS of $3.82, beating by $0.34. Despite a revenue miss, $9.2B in total net premiums were written, a gain from $8.7B from the prior year. Core operating income beat consensus and P&C underwriting income increased from $622M in Q1 2021 to $1.3B in Q1.
We had an excellent start to the year with record operating earnings and underwriting results, double-digit commercial premium growth accompanied by rate increases in excess of loss cost, and growing momentum in our consumer businesses globally,” -Chubb CEO and Chairman, Evan G. Greenberg.
In addition, $1.2B was returned to shareholders, including $905M in share repurchases and $342M in dividends. The success and incredible momentum have allowed the company to raise its dividend by 4% to $0.83. As we look at the A+ profitability grade, although gross profit margins are not ideal, the company is cash-flush with $11.48B and continued underwriting profits that outperform its peers. As financial journalist Mike Thomas wrote in his article, Chubb Is A Global Leader In An Industry Poised To Outperform The Market:
The company has consistently earned excellent underwriting profits, with its combined ratio topping that of its peers…Chubb has shown strong profitability and an ability to generate large and growing free cash flows, which it has used to increase its dividends for each of the last 28 years.
Chubb has a solid balance sheet, and its forward revenue growth projections of 9% are solid. With additional income streams from commercial and international retail, CB’s commercial P&C premiums increased 15%, with the global retail business seeing a 13% increase in Q4.
Adding insurance to investment portfolios is an excellent diversifier because they are recession-resilient and provide protections that many other sectors do not. Consider adding P&C insurance stocks to your portfolio and energy and commodity stocks for the upcoming Fed hikes.
FBN Holdings Plc. (“FBNH” or “FBNHoldings” or the “Group”) today announces its audited results for the financial year ended 31 December 2021.
As a financial service holding company, driving synergies remains a critical part of our strategy and has been integrated into every aspect of our delivery model. We pride ourselves in the uniqueness of our diversified portfolio and the collaborative ecosystem that we have built around our lines of business, our customers, and the unique value proposition that we deliver. We are also increasingly leveraging technology – artificial intelligence, robotics, and other next-generation technological advancements, to deepen collaboration and further drive operational efficiency across the Group.
Highlighting revenue and profitability, the Group delivered a stellar performance growing gross revenue by 28.2% to ₦757.3 billion and profit before tax by 99.1% to ₦166.7 billion. The 30.0% growth in loans and advances to ₦2.9 trillion and 16.2% growth in total asset to ₦8.9 trillion reaffirms our commitment to drive revenue and profitability as we complete the balance sheet clean-up.
In 2022, our strategic focus is on revenue generation through digital channels and retail product offerings, further driving our synergy potential as well as continuing to improve our operating model to deliver more efficiencies”.
Commenting on the results, Dr. Adesola Adeduntan, Chief Executive Officer of FirstBank Group said:
“Following years of strategic restructuring of the Bank’s balance sheet and operations, the Commercial Banking business is beginning to transition into a sustained growth phase delivering performance commensurate to the size of our business and capabilities of our people. Profit before tax is up 77.9%, gross earnings 30.3%, total assets 15.9% and customer deposits up 19.5%.
Gross earnings grew by 28.2% to ₦757.3 billion (Dec 2020: ₦590.7 billion). Interest income remained challenged given the moderated interest rate environment negatively impacting yields; as a result, interest income declined 4.1% to ₦369.0 billion (Dec 2020: ₦384.8 billion). To mitigate the effect of the low interest rate on investment securities and revenue generation, we remained deliberate with our intensified deposit mobilization and funding strategy to support enhanced loan growth at optimised rates leading to a 5.7% increase in interest expense to ₦140.8 billion (Dec 2020: ₦133.2 billion). As a result, net interest income declined by 9.3% to ₦228.2 billion (Dec 2020: ₦251.6 billion).
Conversely, non-interest revenue grew by 96.1% to ₦364.6 billion (Dec 2020: ₦185.9 billion) on the back of increased fees and commission income, treasury activities and other operating income. Additionally, and in line with our focus to further enhance our revenue generation capacity, First Pension Custodian Limited, a subsidiary of FBNHoldings’ flagship subsidiary, First Bank of Nigeria Limited, entered into a definitive agreement with Access Bank Plc for the planned acquisition of the entire share capital of Access Pension Fund Custodian Limited held by Access Bank Plc.
This will further boost our market share in the industry, aid revenue diversification and support annuity income. Looking ahead, we will continue to create quality loans with focus on retail lending driven by technology as we continue to grow non-interest income to further diversify revenue.
In 2021, FBNH operated in a challenging operating environment that was pressured by high inflation and currency devaluation, the effect of which increased operating expenses by 14.2% to ₦334.2 billion (Dec 2020: ₦292.5 billion). However, this 14.2% is below the inflation level (Dec 2020: 15.6%) whilst regulatory cost also rose during the period, up 23.2% y-o-y. Despite the inflationary push factors, operating income grew 35.5% to ₦592.8 billion (Dec 2020: ₦437.6 billion), resulting in an improvement in cost to income ratio to 56.4% (Dec 2020: 66.8%). Going forward, we will sustain our focus towards further improving efficiency by containing cost and increasing revenue.
Deposit from Customers increased by 19.5% y-o-y to ₦5.9 trillion (Dec 2020: ₦4.9 trillion) reaffirming our strong market access and robust funding base. Our investment in agent banking, digitalisation and deployment of digital platforms which our customers have adopted, improved customer penetration and deepened our solid retail franchise. This continues to provide us with access to stable funding, reducing our cost of fund ratio to 2.1% (Dec 2020: 2.3%) while supporting the float of our current and savings account (CASA) at 91.2% (First Bank of Nigeria).
Total assets grew 16.2% y-o-y to ₦8.9trillion (Dec 2020: ₦7.7trillion) driven by a 30.0% y-o-y increase in customer loans and 26.3% increase y-o-y in investment securities. Cash and balances with Central Banks, loans to banks & customers and investment securities constitute 87.2% of total assets (Dec 2020: 83.4%).
We continue to record progress in Asset Quality and Risk Management stemming from our retooled and strengthened risk management architecture. On the back of this, non-performing loan ratio further declined to 6.1% (Dec 2020: 7.7%) while coverage ratio improved to 62.2% (Dec 2020: 48.0%).
With a cleaner balance sheet and resilient earnings generating capacity, FirstBank (Nigeria) was able to accrete capital buffers from organic earnings. Hence, despite the increase in loans and advances, Capital Adequacy Ratio (CAR) remained steady, marginally increasing to 17.4% (Dec 2020: 17.0%).
#RHOL: Chioma and Carolyna’s Five Hours Lateness, #BBNAIJA to grace our screens, yet again plus more engaging trends on TwitterNaija.
For up-to-the-minute updates on trending stories and news, Twitter remains the social media platform that keeps you informed. This week on #TwitterNaija is a recap of the latest in music, movies, sports, and entertainment you might have missed on Twitter.
#BBNAIJA to grace our screens, yet again
The 7th season of Big Brother Naija is well underway with the announcement of open auditions. The reality show is popular for its drama, Friday night parties, love triangles, entertaining housemates, eviction series and the unpredictable daily tasks. Also, the explosive reunion of the #ShineYaEye season is scheduled for 2nd June, and understandably, suspense filled social media snippets have people on Twitter hyped about the announcement.
#RHOL: Chioma and Carolyna’s Five Hours Lateness
This week, we saw even more drama from #RealHouseWivesOfLagos as Chioma and Carolyna arrived five hours late to a dinner organized by Mariam. Folks on Twitter expressed their disappointment about the ladies’ inability to keep to time. Also, #RHOL fans on #TwitterNaija strongly believe that Laura is intimidated by Chioma. Click here for more conversations on the show.
London-To-Lagos Biker Verified on Twitter
Kunle Adeyanju, a biker who is motorbiking from Lagos to London, as part of a Polio eradication campaign, recently received a blue tick on his Twitter account. The news of his Verification saw #LagosToLondon trending on #TwitterNaija, contributing to the impact of his mission being noticed and recognized globally. He Tweeted to celebrate the 11,301km mark, and continues to raise funds on Twitter, which will be channeled to the Rotary Club’s PolioPlus Foundation to support Polio eradication. Follow updates on the #EndPolio campaign.
Progress wins Nigerian Idol Season 7
Progress Chukwuye has emerged as the winner on talent show Nigerian Idol.Following a heated contest against Zadok, Pastor P, as he’s popularly called on the show, ended the show with an outstanding performance. It was an emotional moment for his fans on Twitter after his moment in the spotlight was announced via this Tweet from @Nigerianidol, Check out some Tweets from the celebration here.
Manchester United loses to Crystal Palace
In the just concluded premier league, Manchester United lost to Crystal Palace with a score of 1-0. #TwitterNaija Football fans criticized Man U for not winning any games since Cristiano Ronaldo left the club. Here is a thread of reactions from fans on #TwitterNaija
@Twitterremains your official source for what’s happening!
Savannah Energy plc, the British independent energy company focused around the delivery of Projects that Matter in Africa, is pleased to announce the signing of an agreement (“the Agreement”) with the Ministry of Petroleum and Energy of the Republic of Chad for the development of up to 500 megawatts (“MW”) of renewable energy projects supplying electricity to the Doba Oil Project and the towns of Moundou and Doba in Southern Chad, and the capital city, N’Djamena (“the Projects”).
A signing ceremony was held today in N’Djamena, attended by His Excellency Djerassem le Bemadjiel, the Minister of Petroleum and Energy of the Republic of Chad, His Excellency Mark Matthews, Ambassador of the United Kingdom to the Republic of Chad, Sarah Wilson, Deputy Head of Mission at the British Embassy N’Djamena, Chad, and Andrew Knott, Chief Executive Officer of Savannah.
Centrale Solaire de Komé
The first Project Savannah has agreed to develop comprises an up to 300 MW photovoltaic solar farm and battery energy storage system (“BESS”) located in Komé, Southern Chad (the “Centrale Solaire de Komé”). This Project is being developed to provide clean, reliable power generation for the Doba Oil Project and the surrounding towns of Moundou and Doba. In doing so, it will displace existing hydrocarbon power supply resulting in a significant reduction in CO2 emissions and provide a supply of clean, reliable electricity on a potential 24/7 basis to the surrounding towns of Moundou and Doba (which currently only have intermittent power access). The expected tariff for the electricity generated from this Project is expected to be significantly less than that being paid for the current hydrocarbon-based power generation in the region. At 300 MW, the Centrale Solaire de Komé would be the largest solar project in sub-Saharan Africa (excluding South Africa) as well as constituting the largest battery storage project in Africa. Project sanction for the Centrale Solaire de Komé is expected in 2023 with first power in 2025.
Centrales d’Energie Renouvelable de N’Djamena
The second project covered by the Agreement involves the development of solar and wind projects of up to 100 MW each to supply power to the country’s capital city, N’Djamena (the “Centrales d’Energie Renouvelable de N’Djamena”). A significant portion of this project is anticipated to benefit from the installation of a BESS, potentially enabling the provision of 24/7 power supply. At up to 200 MW, the Centrales d’Energie Renouvelable de N’Djamena would more than double the existing installed generation capacity supplying the city and increase total installed grid-connected power generation capacity in Chad by an estimated 63%. Savannah expects the cost of power from the Centrales d’Energie Renouvelable de N’Djamena to be lower than existing competing power projects, which are currently primarily hydrocarbon-based. Project sanction for the Centrales d’Energie Renouvelable de N’Djamena is expected in 2023/24 with first power in 2025/26.
Savannah expects to fund the Projects from a combination of its own internally generated cashflows and project specific debt.
His Excellency Djerassem le Bemadjiel, the Minister of Petroleum and Energy of the Republic of Chad, said:
“We are delighted to work with Savannah on these two potentially transformational power projects for Chad. Our country is blessed with a significant renewable energy resource and we are excited that a leading British company such as Savannah is seeking to harness this resource to provide utility scale power to our country. I warmly welcome the projects and Savannah’s entry into the Chadian power sector. We are already engaged to provide all the support needed for implementing these projects and having the first power delivered to our population and our industries in line with the State plan for enhancing the power offering in our country.”
His Excellency Mark Matthews, Ambassador of the United Kingdom to the Republic of Chad, commented:
“I am delighted that a British company, Savannah Energy, is making such a substantial investment in renewable energy in Chad. Chad has plentiful resources of renewable energy which, through investments like this, can be harnessed to develop the economy and improve the lives of Chadians. This is a further example of UK commitment to Chad.”
Andrew Knott, Chief Executive Officer, Savannah Energy, commented:
“I am delighted to announce the Centrale Solaire de Komé and the Centrales d’Energie Renouvelable de N’Djamena projects. Both of these represent a major vote of confidence in Chad by Savannah and have the potential to contribute to a transformative change in the country’s GDP over the course of the coming years, as well as bringing the significant quality of life benefits associated with access to regularised power to the regions in which the Projects are situated. The Projects represent one of the largest ever foreign direct investments in Chad and are believed to the largest ever by a British company.
I would like to thank General Mahamat Idriss Deby Itno, President of the Transitional Military Council, President of the Republic of Chad and Head of State; His Excellency Djerassem Le Bemadjiel, Minister of Petroleum and Energy of the Republic of Chad, and the wider Chadian government for the enthusiastic support we have received in relation to making these projects happen. We look forward to working with the Government and our developmental finance partners over the course of the coming years as we move through the feasibility and construction phases of the projects to our intended first power dates in 2025/26.
Centrale Solaire de Komé and Centrales d’Energie Renouvelable de N’Djamena are the second and third large-scale greenfield renewable energy projects that Savannah has announced this year, following on from our announcement of the up to 250 MW Parc Eolien de la Tarka project in Niger. We expect to announce our involvement in further large-scale greenfield power projects over the course of the next 12 months”
TECNO ranked among the top 6 brands on the African continent for the sixth consecutive year, testifying to the staying power of TECNO brand’s leadership in Africa. Established in 2011, the Brand Africa 100: Africa’s Best Brands rankings are the most authoritative survey and analysis of African brands and businesses.
TECNO kept its position despite the challenges of the pandemic that saw worldwide supply and demand issues. With Brand Africa’s new rankings, TECNO has once again come out tops, maintaining their position in mid to high-end mobile brand segments in Africa.
TECNO’s investment and commitment to bringing consumer-centric mobile technology to the African continent is exemplary. TECNO brand spokesperson shared that, “We are delighted to continue to receive this honor over the years. We put a lot of effort and continuous deep cultivation in the African market, aiming to provide consumers with reliable products, powerful and innovative mobile technology, all based on an in-depth understanding of the customized needs of African users.”
TECNO’s making its promise to bridge the digital gap through continuous technology and innovation. For example, it was on full display in a webinar entitled “Global Mobile Camera Trends 2022: Innovation Talk” (https://bit.ly/3GnDgnx), with guest speakers from Counterpoint, TECNO, Samsung Electronics and DXOMARK. Early this year, TECNO also collaborated with BBC Storyworks and created a short film The Future Lens: Looking Ahead With TECNO (https://bbc.in/3N6BObq), to explore the meaning of mobile camera innovation for people’s life. TECNO’s concept phone launch with new Telescopic Macro Lens technology (https://bit.ly/3z6J6Ia) is another vision for the future of mobile cameras. The objective of ‘Future Lens’ on its camera innovation is to allow users to showcase their uniqueness via visual storytelling, filling their world with diversified beauty through mobile camera innovation.
TECNO keeps demonstrating its global level of technology and innovation with its brand mission of becoming the most admired tech brand in Africa and global emerging markets by continually making breakthroughs in technology innovation. TECNO is deeply committed to its role in the mobile technology field and is dedicated to bringing the innovative and stylish products to its customers.
A 29-year-old wreck in New Zealand has been converted into a homemade electric vehicle “to show it can be done.”
For the past three years, Rosemary Penwarden has been driving her converted vehicle around South Island roads. It took her and a friend more than eight months of hard work and tinkering to complete the project. “You have to be a little crazy,” she said. “I’d like to thank the oil companies for providing motivation.”
Penwarden purchased a 1993 car body from a wrecker and removed the combustion engine herself. She replaced it with a new gearbox and electric engine, then packed batteries in the front and back of the car – 24 under the hood and 56 in the boot.
Penwarden spent $24,000 (£12,300) on the project in total, including labor. The vehicle has been fully signed off and warranted. Her project was recently brought to the attention of local reporters after several years on the road.
Hagen Bruggemann, a refrigeration engineer who assisted Penwarden in converting her car, has now converted about eight cars to electric engines. “You can talk all you want about the environment, but you have to do something about it,” he says.
He claims that without free labor, converting a car is not a financially viable option for most people – but there is a strong commercial case for converting trucks and larger vehicles, where the body is worth far more than the engine. He claims that converting a diesel truck will pay for itself in five years.
Penwarden spent $24,000 (£12,300) on the project in total, including labor. The vehicle has been fully signed off and warranted. Her project was recently brought to the attention of local reporters after several years on the road.
Hagen Bruggemann, a refrigeration engineer who assisted Penwarden in converting her car, has now converted about eight cars to electric engines. “You can talk all you want about the environment, but you have to do something about it,” he says.
He claims that without free labor, converting a car is not a financially viable option for most people – but there is a strong commercial case for converting trucks and larger vehicles, where the body is worth far more than the engine. He claims that converting a diesel truck will pay for itself in five years.
Penwarden, a long-time environmental activist, says the time and money she spent converting her car aren’t for everyone – “I’m in a very privileged place” – but as the world adapts to the climate crisis, she wanted to demonstrate the possibility. She charges the car at her solar-powered residence.
While Penwarden believes the car will pay for itself (she used to spend up to $100 per week on gasoline for commuting), she claims it is not a cost-cutting exercise and has called on the government to support conversions. “Just to be able to demonstrate that it can be done is priceless,” she says. “The most important thing is to help stop the biggest polluters as soon as possible – and there is nothing we can do about it.”
We use cookies on our website to give you the most relevant experience by remembering your preferences and repeat visits. By clicking “Accept”, you consent to the use of ALL the cookies.
This website uses cookies to improve your experience while you navigate through the website. Out of these, the cookies that are categorized as necessary are stored on your browser as they are essential for the working of basic functionalities of the website. We also use third-party cookies that help us analyze and understand how you use this website. These cookies will be stored in your browser only with your consent. You also have the option to opt-out of these cookies. But opting out of some of these cookies may affect your browsing experience.
Necessary cookies are absolutely essential for the website to function properly. This category only includes cookies that ensures basic functionalities and security features of the website. These cookies do not store any personal information.
Any cookies that may not be particularly necessary for the website to function and is used specifically to collect user personal data via analytics, ads, other embedded contents are termed as non-necessary cookies. It is mandatory to procure user consent prior to running these cookies on your website.